Cumberland County sits at the bottom of New Jersey's attendance rankings. Its school districts average 18.8% chronic absenteeism in 2023-24, meaning roughly one in five students misses 18 or more school days a year. Morris County, 90 miles north on the other side of the state, averages 8.3%. The distance between them is not just mileage.
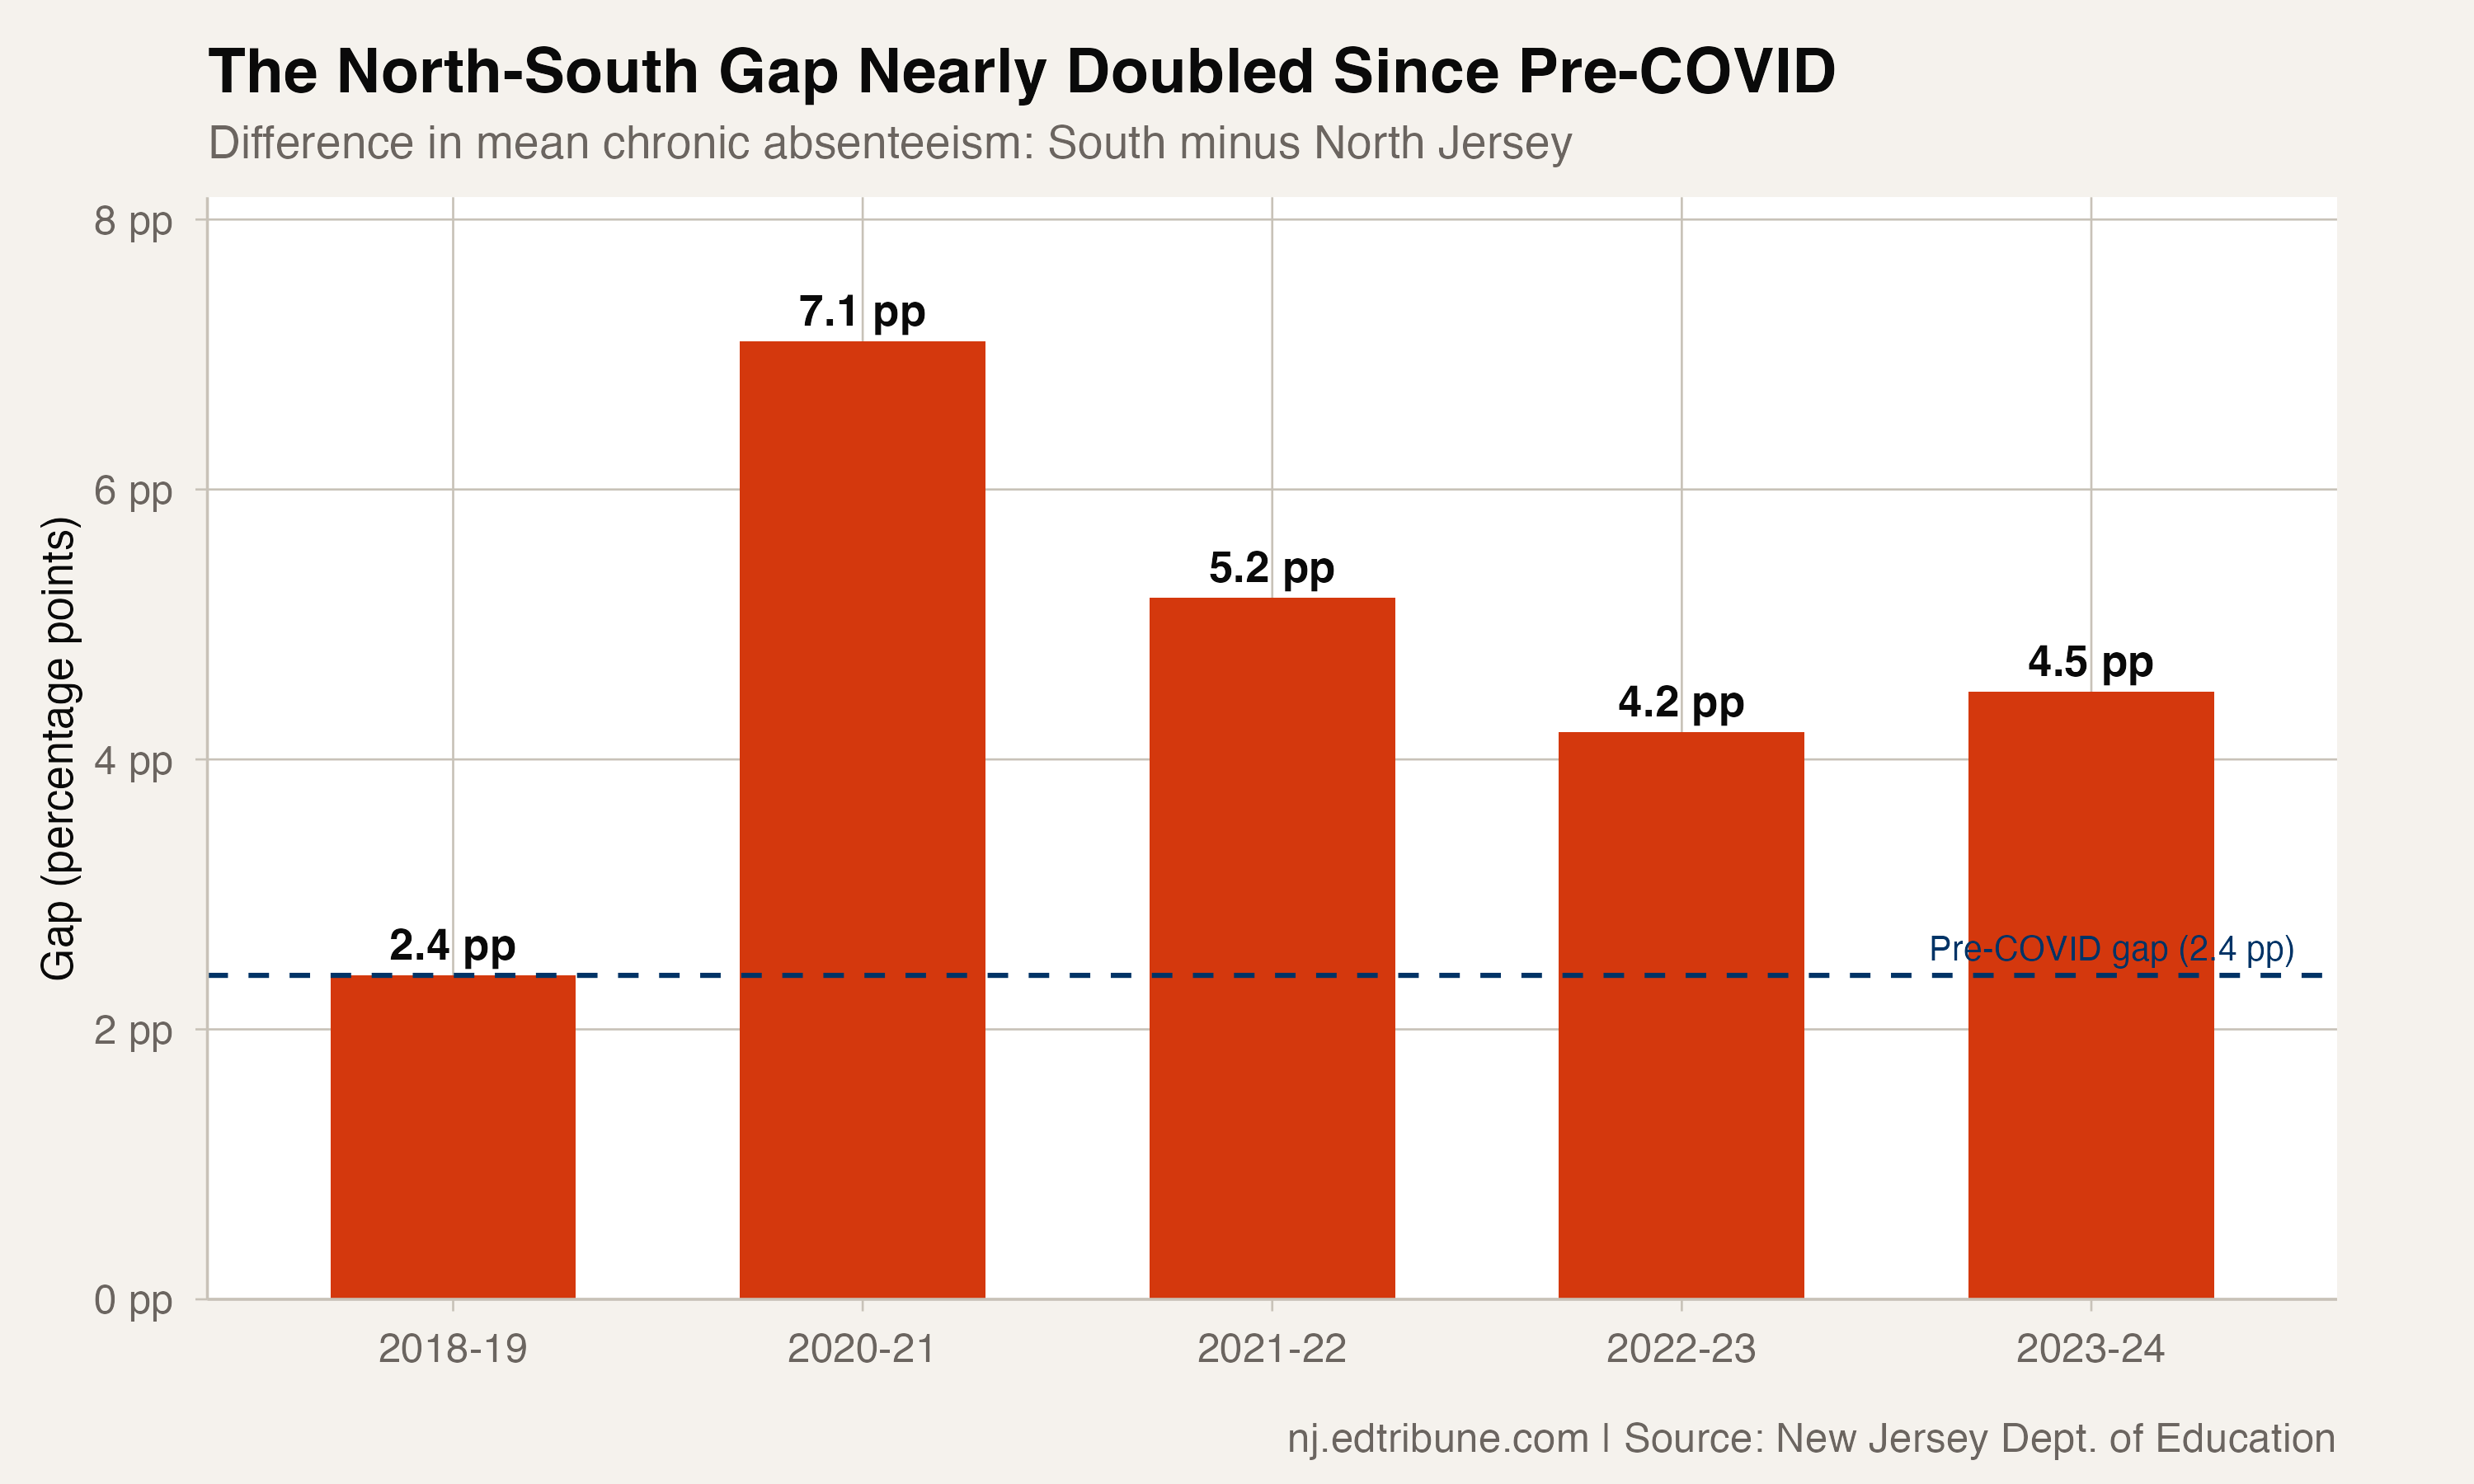
A geographic divide in school attendance has been present in New Jersey for as long as the state has tracked the data. But the pandemic blew it open. In 2018-19, North Jersey's traditional districts averaged 7.5% chronic absenteeism. South Jersey averaged 9.9%. The gap was 2.4 percentage points. By 2023-24, it had nearly doubled to 4.5 points.
Three regions, three trajectories
Splitting New Jersey's 21 counties into North, Central, and South reveals three distinct attendance stories since the pandemic.
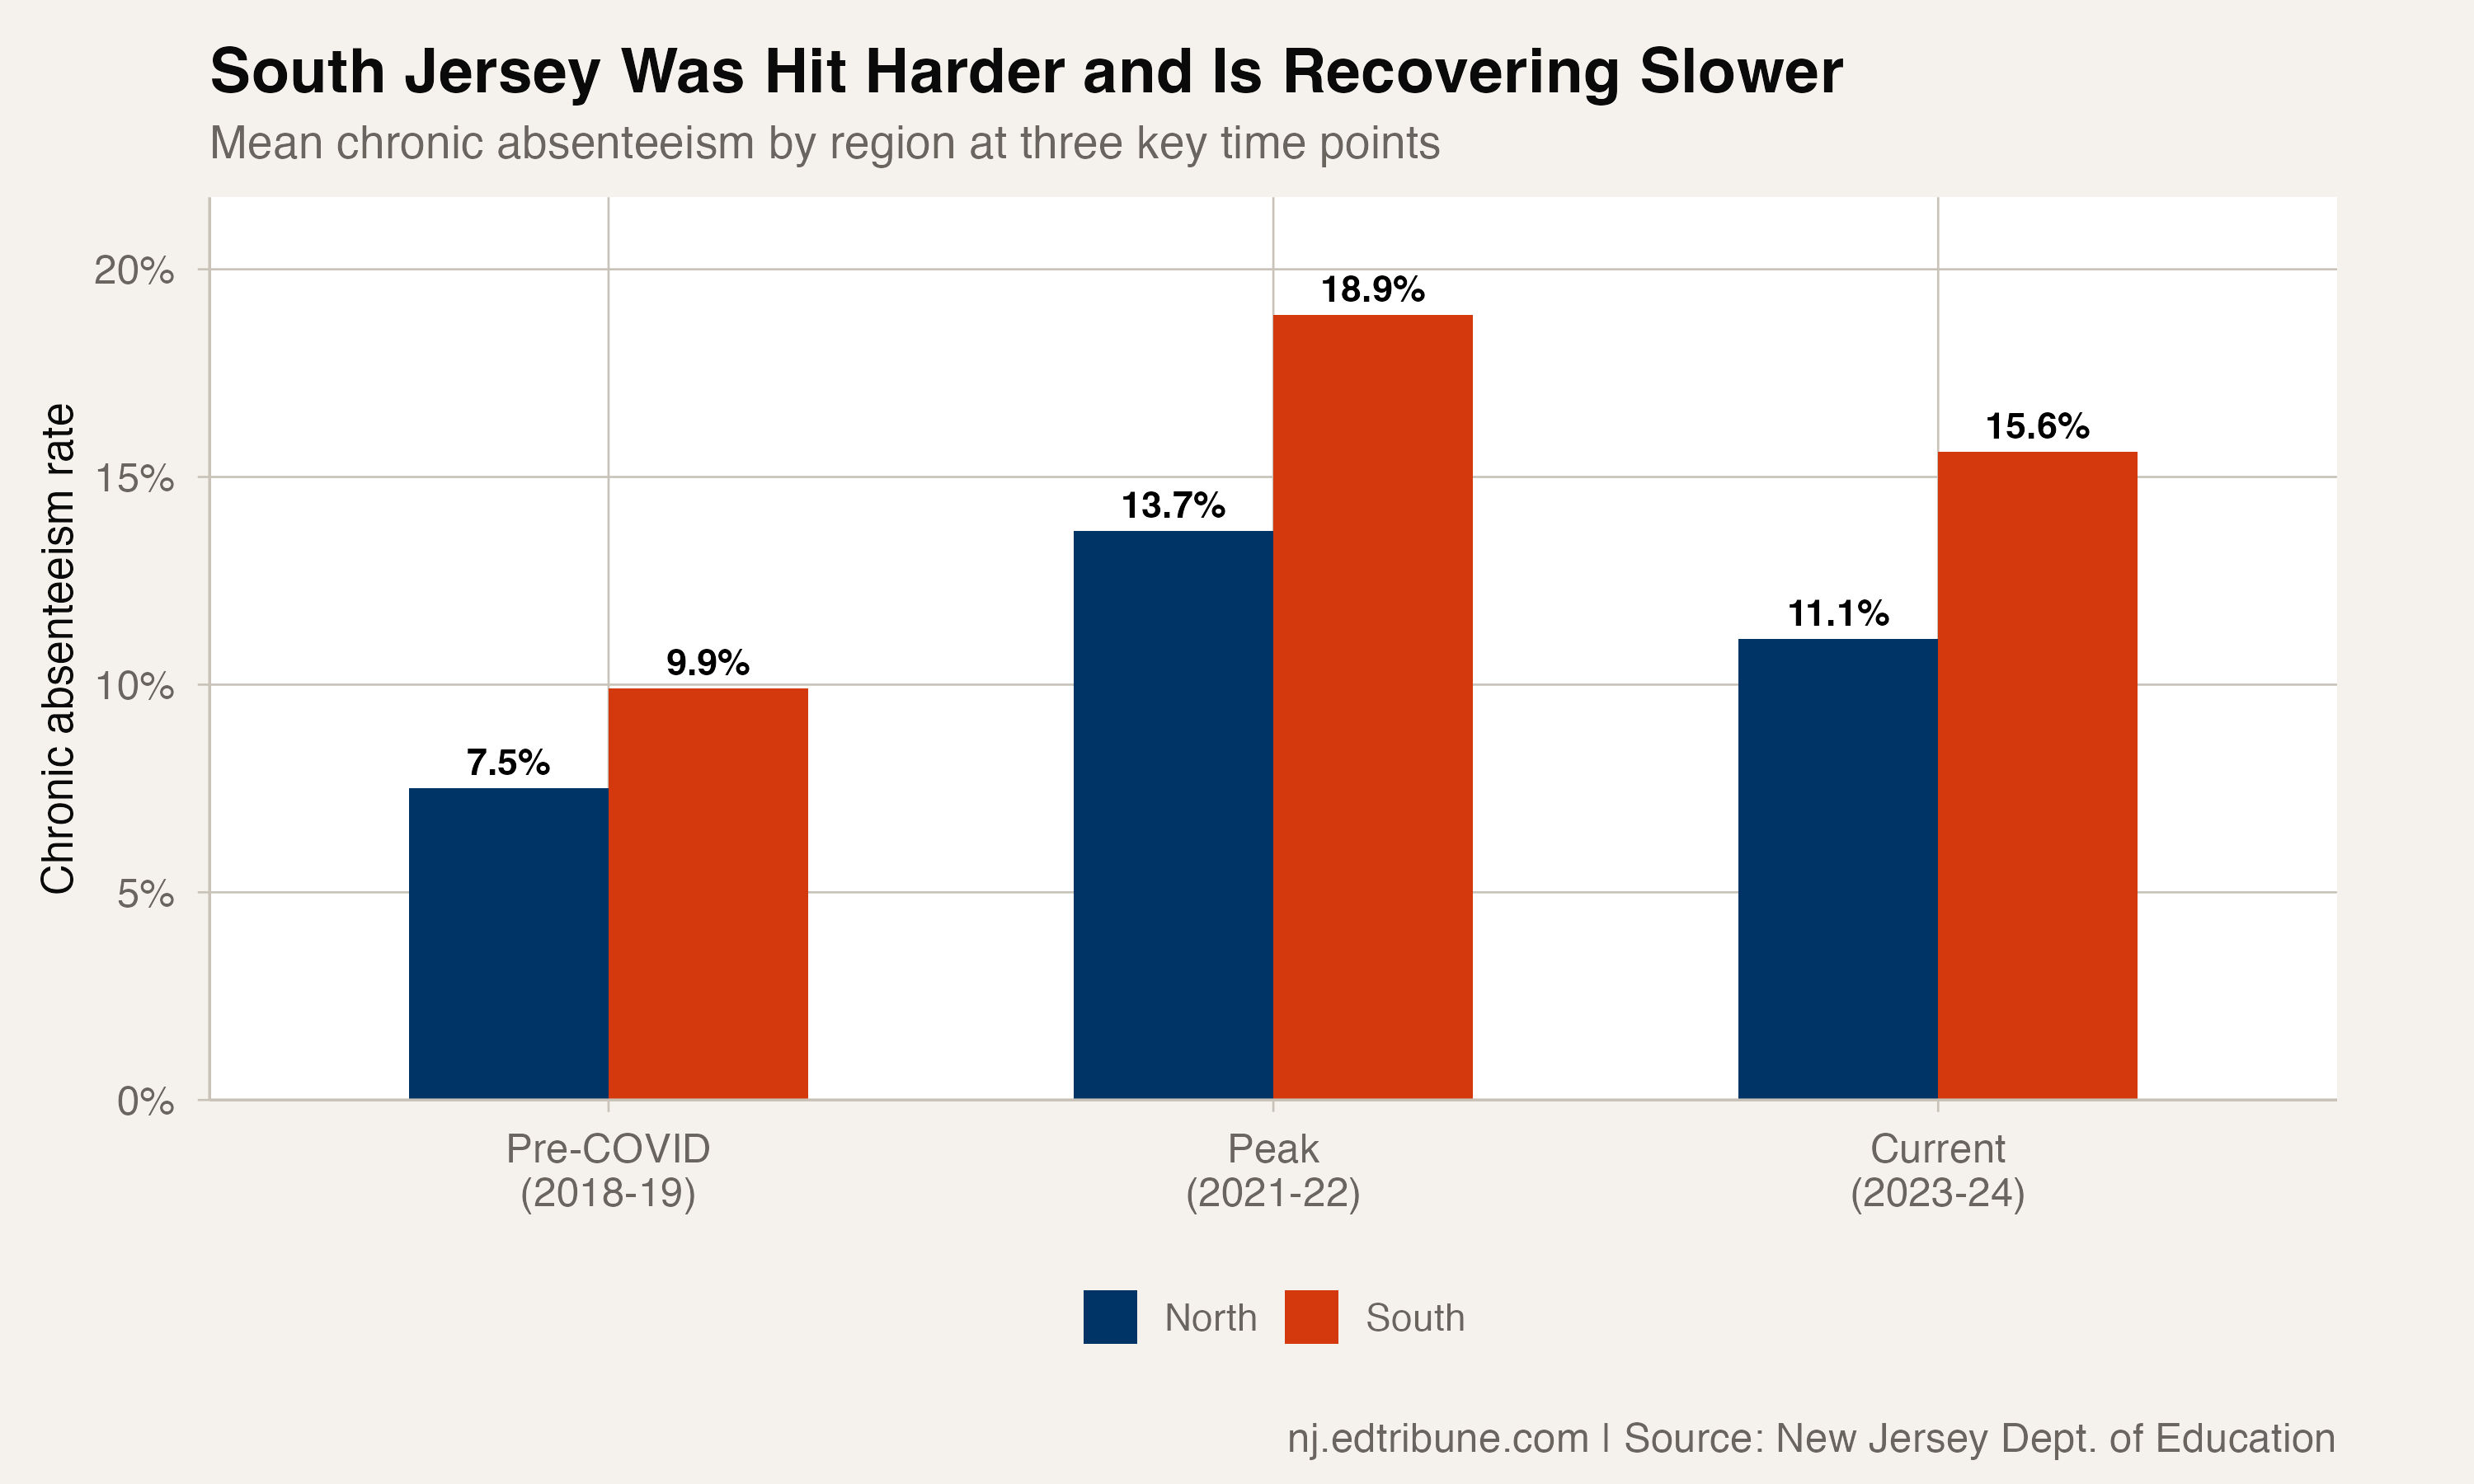
North Jersey (Bergen, Essex, Hudson, Morris, Passaic, Sussex, Union, and Warren counties, 237 traditional districts) averaged 7.5% chronic absenteeism pre-COVID. The pandemic pushed that to 13.7% in 2021-22. By 2023-24, the region had recovered to 11.1%, still 3.5 points above its baseline but moving steadily in the right direction. North Jersey has recovered 42.9% of its pandemic-era increase.
South Jersey (Atlantic, Burlington, Camden, Cape May, Cumberland, Gloucester, Ocean, and Salem counties, 198 traditional districts) started higher at 9.9% and was hit substantially harder. Its rate spiked to 18.9% in 2021-22, a 9.0-point surge compared to North Jersey's 6.2-point jump. Two years of improvement brought South Jersey to 15.6%, but the region has recovered only 37.3% of the gap. It remains 5.7 points above where it was in 2018-19.
Central Jersey (Hunterdon, Mercer, Middlesex, Monmouth, and Somerset counties, 129 districts) sits between the two at 11.9%, having recovered 35.4%.
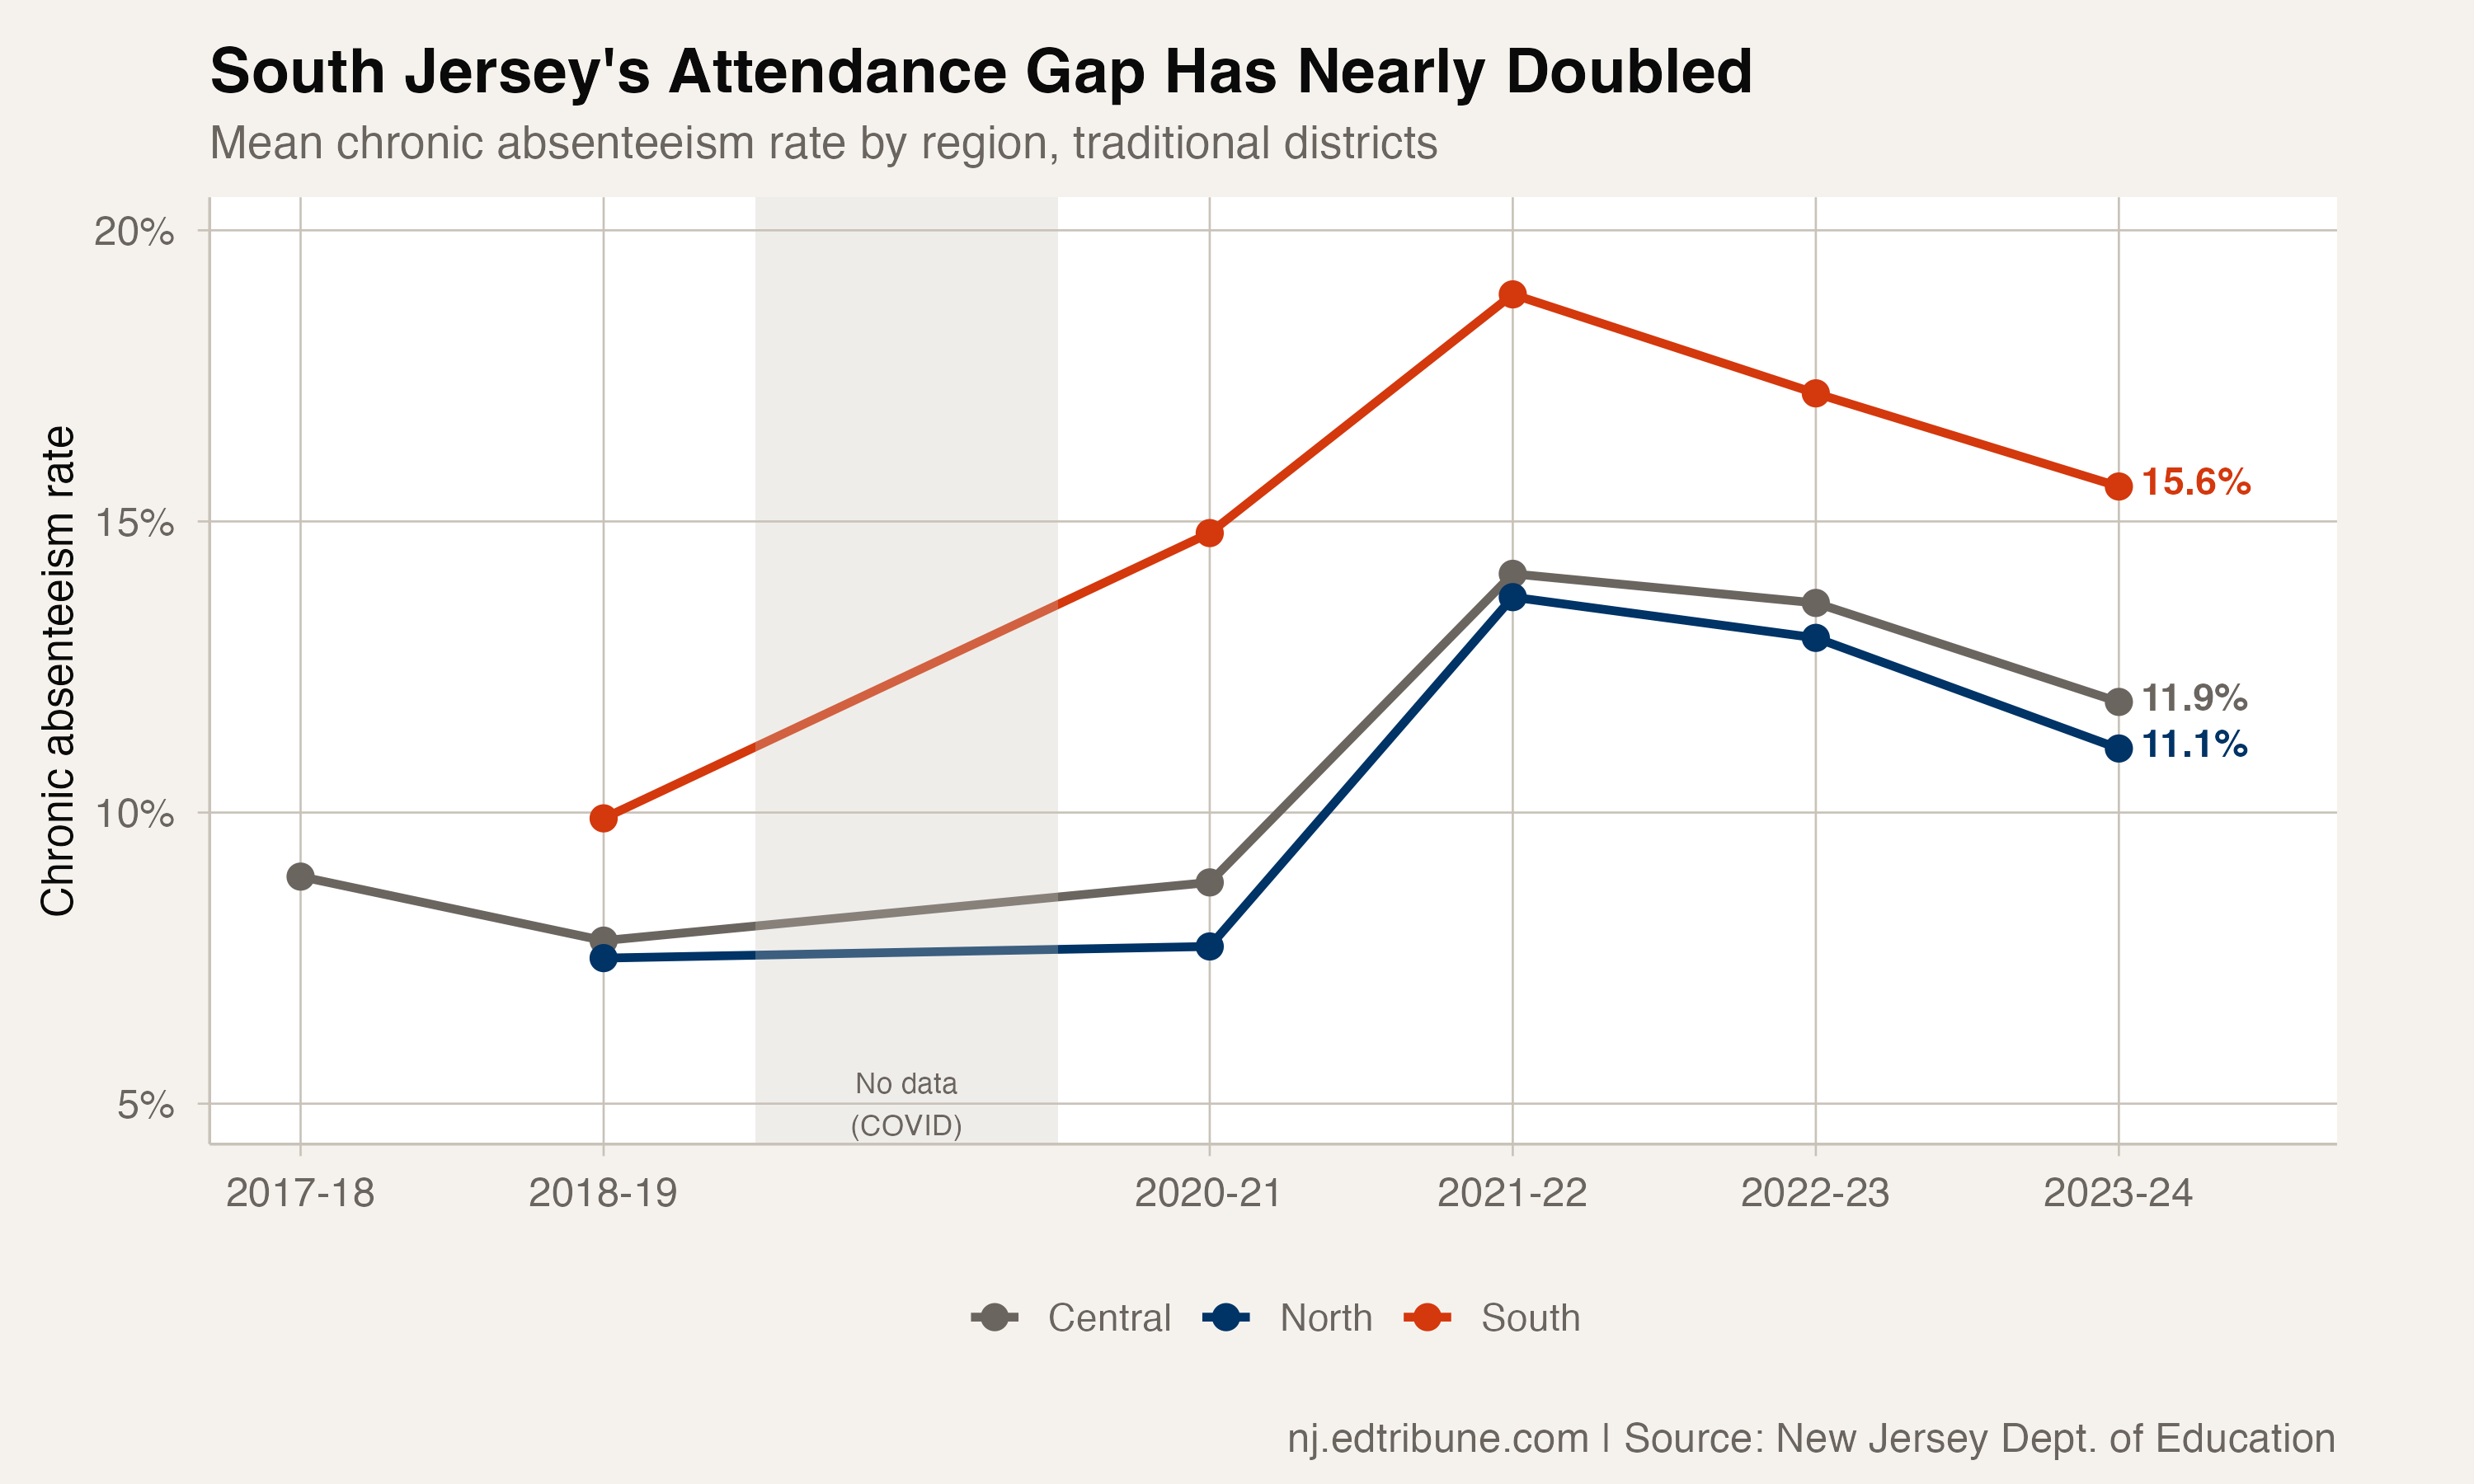
The widest gap did not come in 2021-22. It came the year before. In 2020-21, when districts were still in various stages of remote and hybrid learning, South Jersey averaged 14.8% chronic absenteeism while North Jersey held at 7.7%, a 7.1-point spread. The gap narrowed as the pandemic peak hit both regions in 2021-22, then settled at 4.5 points in 2023-24, nearly double the pre-COVID baseline.
The county map
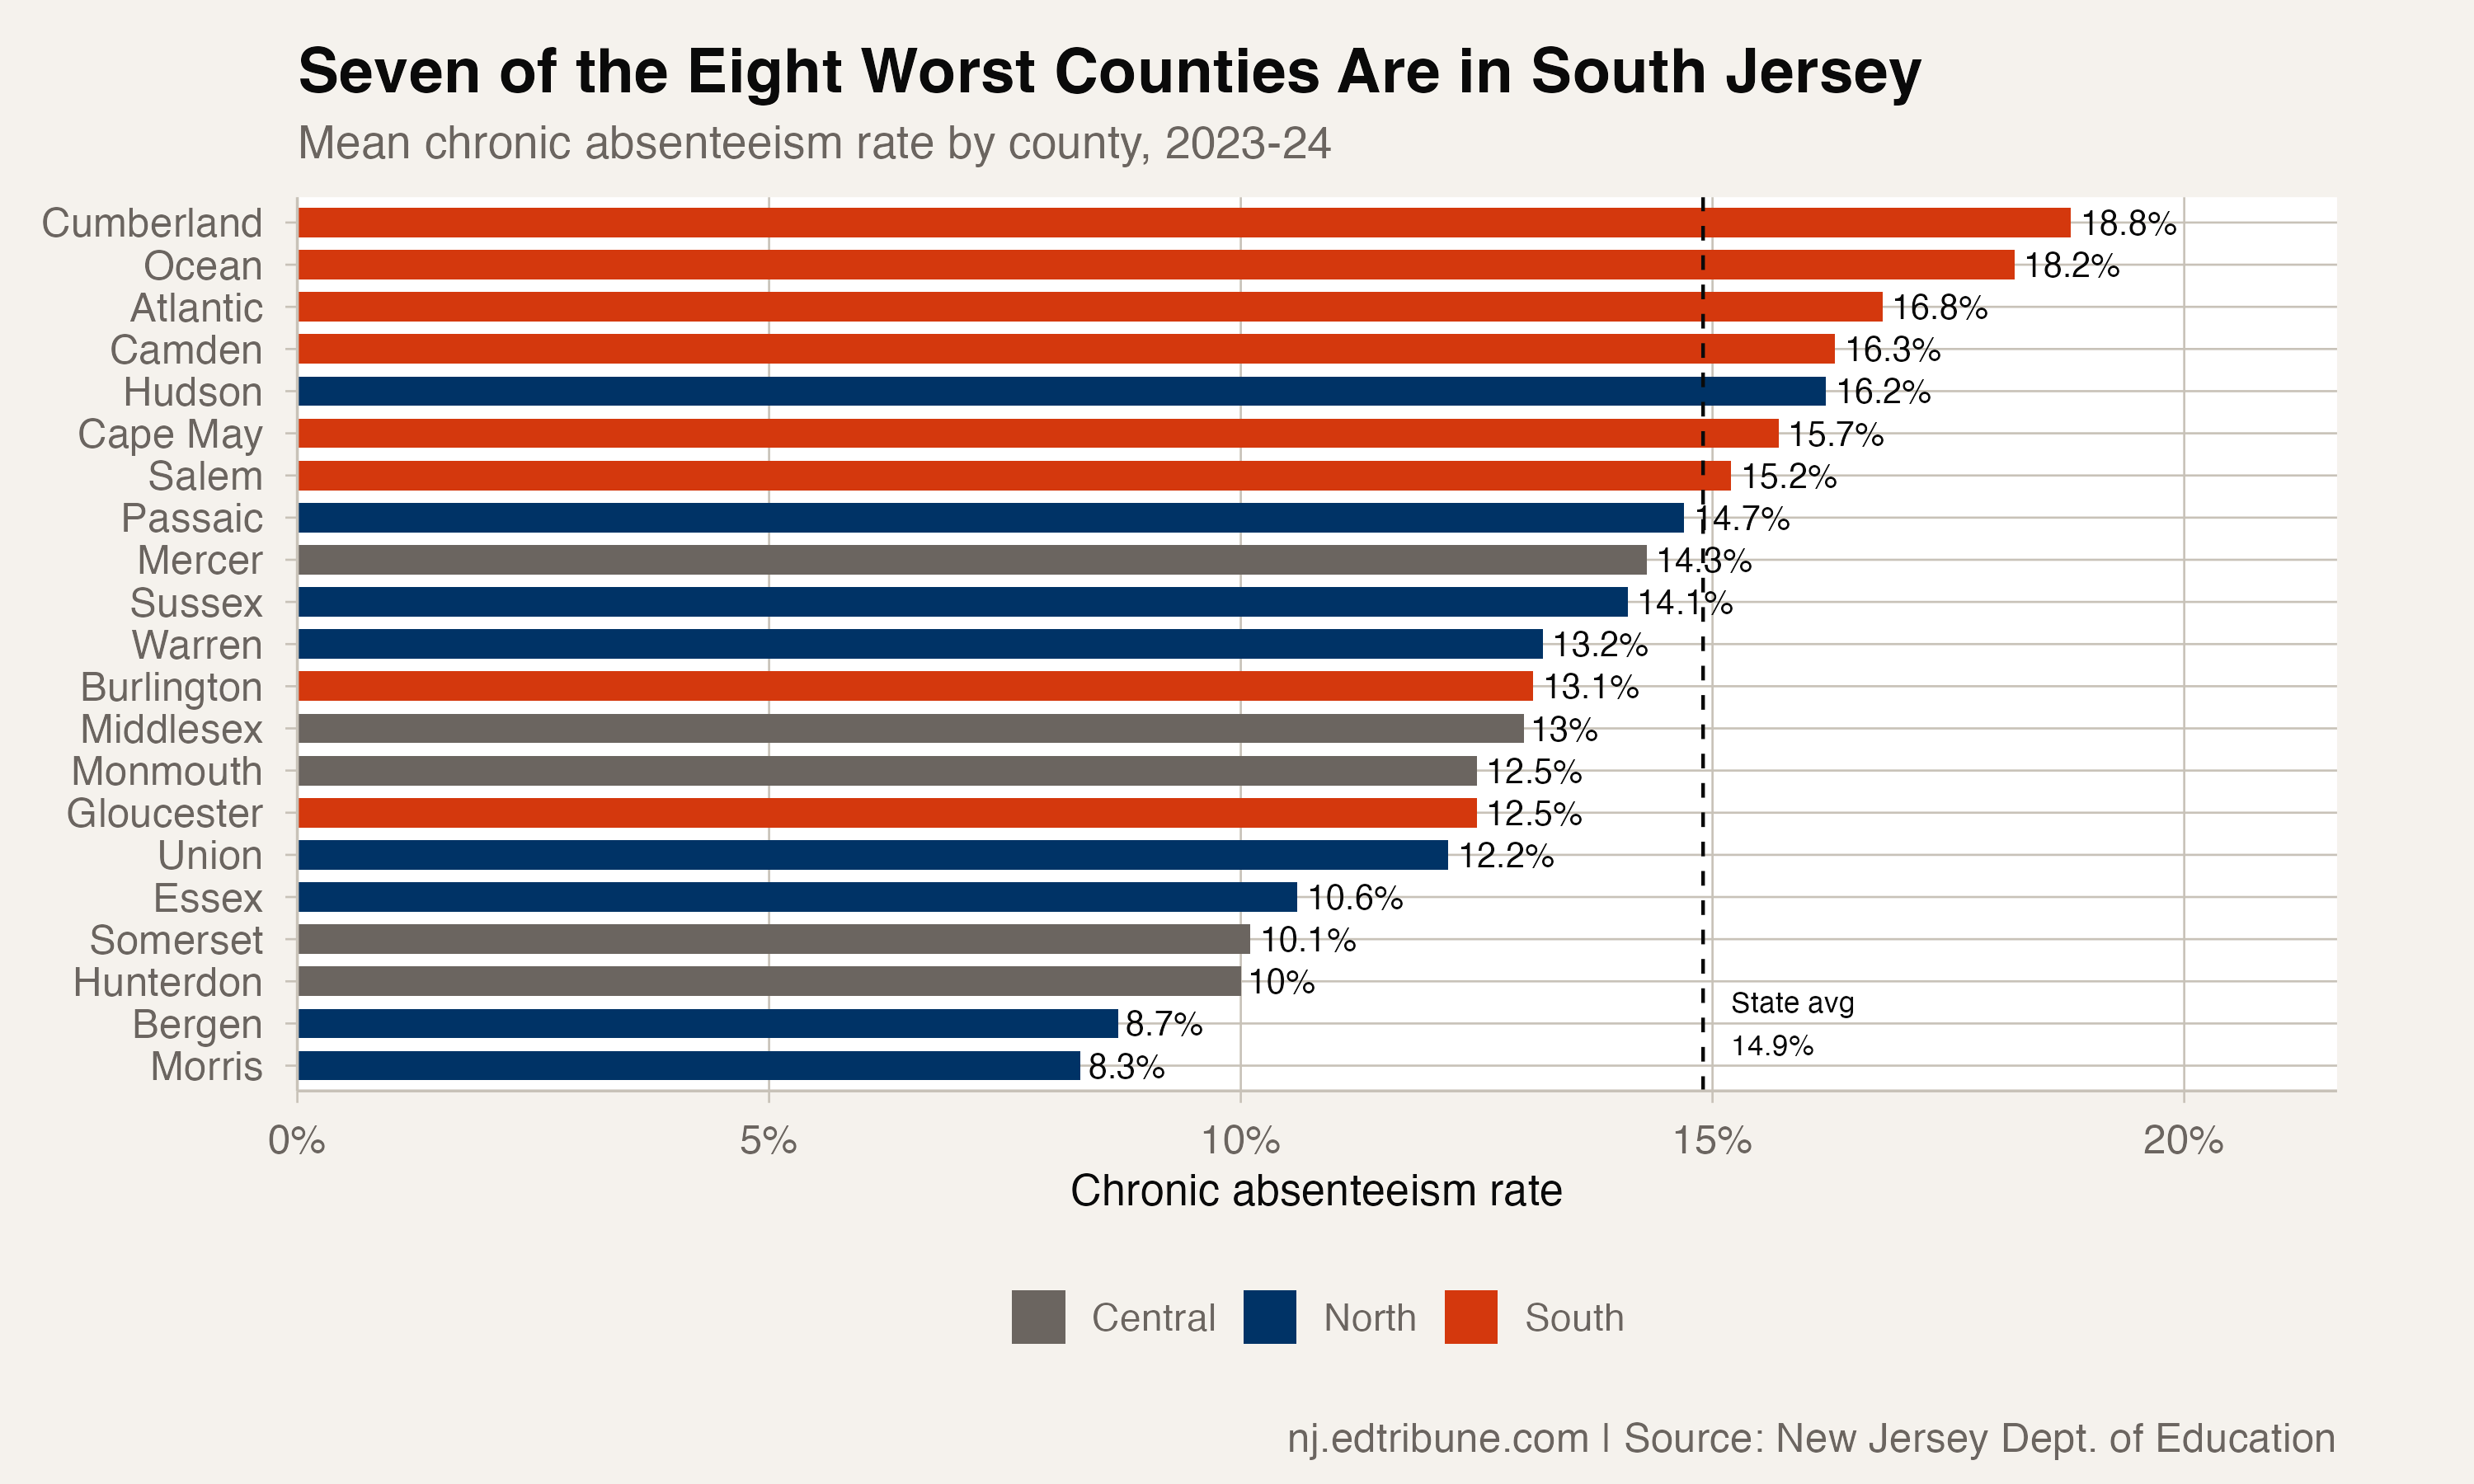
The county-level data sharpens the picture. Of New Jersey's 21 counties, every one of the eight South Jersey counties ranks in the top half for chronic absenteeism. Six of them exceed 15%.
Cumberland↗ET (18.8%) and Ocean (18.2%) are the worst in the state. Atlantic↗ET (16.8%), Camden↗ET (16.3%), Cape May (15.7%), and Salem↗ET (15.2%) follow. Only Burlington (13.1%) and Gloucester (12.5%) sit below the state average of 14.9%.
On the North Jersey side, the picture is more varied. Hudson County (16.2%) and Passaic (14.7%) carry rates comparable to parts of South Jersey, driven by large urban districts like Jersey City and Paterson↗ET. But Bergen (8.7%) and Morris (8.3%) anchor the low end, pulling the regional average down. The gap between the best and worst North Jersey county (7.9 points) is smaller than the gap between the best and worst South Jersey county (6.3 points from Burlington to Cumberland), but South Jersey's entire distribution is shifted higher.
Why South Jersey was hit harder
The raw numbers show what happened. The question of why is harder.
South Jersey's economy looks different from the north. Cumberland County's↗ET median household income is roughly $54,000, less than half of Morris County's $126,000, according to U.S. Census Bureau estimates. The region's employment base leans on agriculture, food processing, hospitality, and seasonal tourism rather than the pharmaceutical, finance, and technology corridors that run through the north. The South Jersey Economic Development District has documented persistently higher poverty rates and lower educational attainment across the region's rural and small-city communities.
Transportation compounds the problem. New Jersey requires districts to provide busing for K-8 students living more than two miles from school and high school students beyond 2.5 miles. In the densely packed North Jersey suburbs, most students live within walking distance. In rural South Jersey, districts cover large geographic areas with limited public transit options.
But these structural factors existed before the pandemic. They do not explain why the gap almost doubled.
Recovery at different speeds
At the district level, the divergence is stark. South Jersey has 44 traditional districts with chronic rates above 20% in 2023-24. North Jersey has 20. South Jersey has 10 districts above 30%. North Jersey has 2.
The worst-performing districts in each region tell different stories. South Jersey's highest rates cluster in small shore towns and urban centers: Camden City↗ET (46.9%), Ocean Gate (43.0%), Seaside Heights (39.1%), Woodbine (36.4%), Salem City↗ET (32.9%), Atlantic City↗ET (31.6%), Pleasantville↗ET (30.5%), and Vineland↗ET (30.3%). These are places where poverty, housing instability, and seasonal employment patterns intersect.
North Jersey's worst rates concentrate in a handful of urban districts: Paterson↗ET (35.7%), Plainfield↗ET (29.1%), East Orange (25.2%), and a few rural high schools in Sussex and Warren counties. The critical difference is that North Jersey's problem districts are exceptions in a sea of low-rate suburbs. South Jersey's problem is broader.
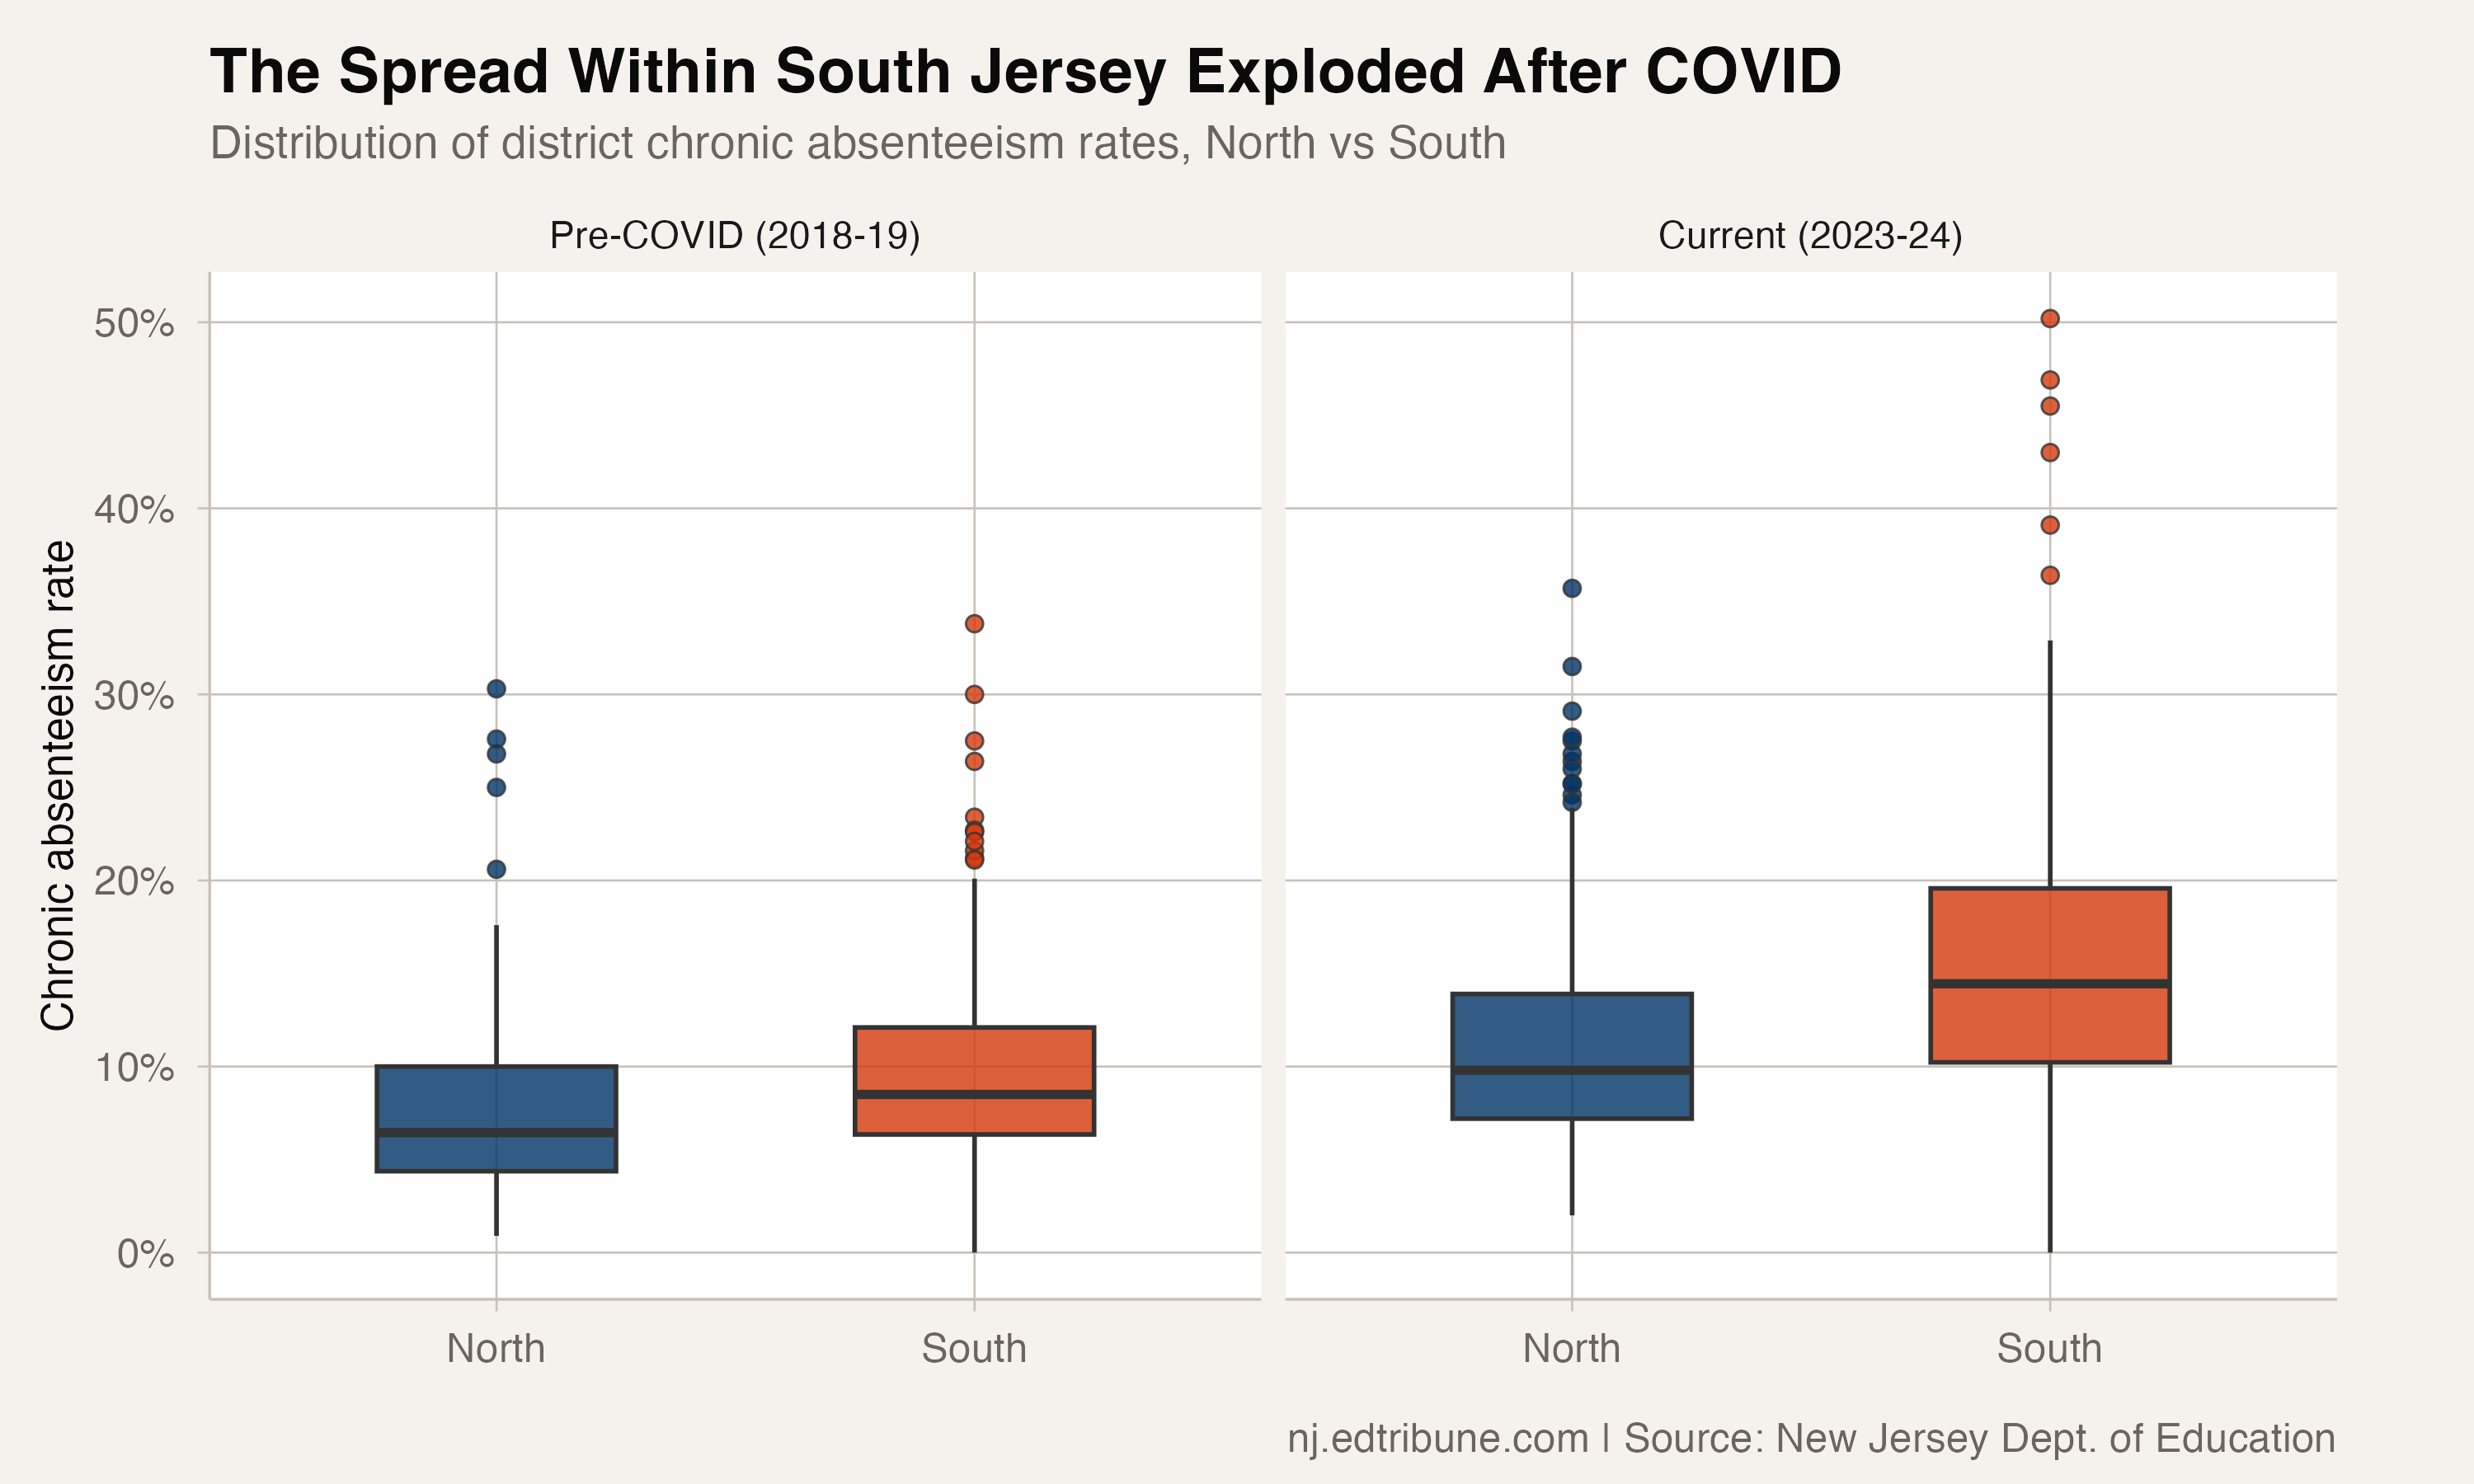
The box plots make this visible. Before COVID, North and South Jersey districts had roughly similar distributions, with South Jersey shifted slightly higher. By 2023-24, South Jersey's distribution had widened dramatically. Its 75th percentile (19.6%) now exceeds North Jersey's by nearly 6 points (13.9%), and its median (14.4%) sits 4.6 points above North Jersey's (9.8%). The pandemic did not just raise South Jersey's average. It stretched out the entire range, creating a longer tail of deeply struggling districts.
What the gap means
New Jersey funds its schools based on enrollment, not attendance. Districts with high chronic absenteeism rates do not lose per-pupil funding the way they would in California or Texas. The financial consequences are indirect, flowing through lower academic outcomes and higher intervention costs rather than direct revenue loss.
That funding structure means South Jersey districts are not bleeding money when students miss school. But they are losing something harder to quantify. The New Jersey Department of Education requires districts with chronic rates above 10% to establish Attendance Review Teams. By that standard, six of South Jersey's eight counties have a county-wide average above 15%, suggesting the problem is beyond what individual district interventions can solve.
The 4.5-point gap between North and South Jersey was 2.4 points before the pandemic. Both regions have been recovering since 2022, but the gap itself has not begun to close. North Jersey recovered 42.9% of its pandemic spike. South Jersey recovered 37.3%. At those rates, the divide widens slightly every year.
The structural factors that separated the two regions before COVID -- income, transportation, employment patterns -- did not change during the pandemic. What changed was how much those factors mattered. A 2.4-point gap was narrow enough to overlook. A 4.5-point gap, with Cumberland County at 18.8% and Morris County at 8.3%, describes two states sharing one education system.
Detailed code that reproduces the analysis and figures in this article is available exclusively to EdTribune subscribers.
Discussion
Sign in to join the discussion.
Loading comments...