In Paterson, 45.9% of Black students were chronically absent last year. In Camden, 51.1%. In Keansburg, a shore borough with a single K-8 school, 46.9%. The statewide number for Black students is 21.4%, which means the concentrations in individual districts are far worse than any average can communicate.
But the statewide number has its own story to tell. In 2023-24, three groups whose chronic absenteeism rates had been diverging for years all landed on the same ledge: Black students at 21.4%, economically disadvantaged students at 21.2%, students with disabilities at 21.0%. A 0.4 percentage point spread, down from 1.6 points before the pandemic and as wide as 3.3 points at the 2022 peak.
These are not the same students. They overlap substantially, but they are measured as separate populations with separate barriers to attendance. That all three stalled at the same rate after two years of improvement is not a coincidence. It is an outline of the structural floor beneath which New Jersey's attendance interventions have not yet reached.
The convergence
Before COVID, these groups were close but distinguishable. In 2018-19, Black students had the highest chronic absenteeism at 17.6%, followed by students with disabilities at 16.5% and economically disadvantaged students at 16.0%. The pandemic blew the rates apart. By 2021-22, Black students and economically disadvantaged students had surged to nearly identical peaks of 28.4% and 28.0%, while students with disabilities reached 25.1%.
Then the recovery compressed them. Black students improved by 7.0 percentage points from peak, economically disadvantaged students by 6.8 points, but students with disabilities dropped just 4.1 points. The fastest recoveries and the slowest converged at 21%.
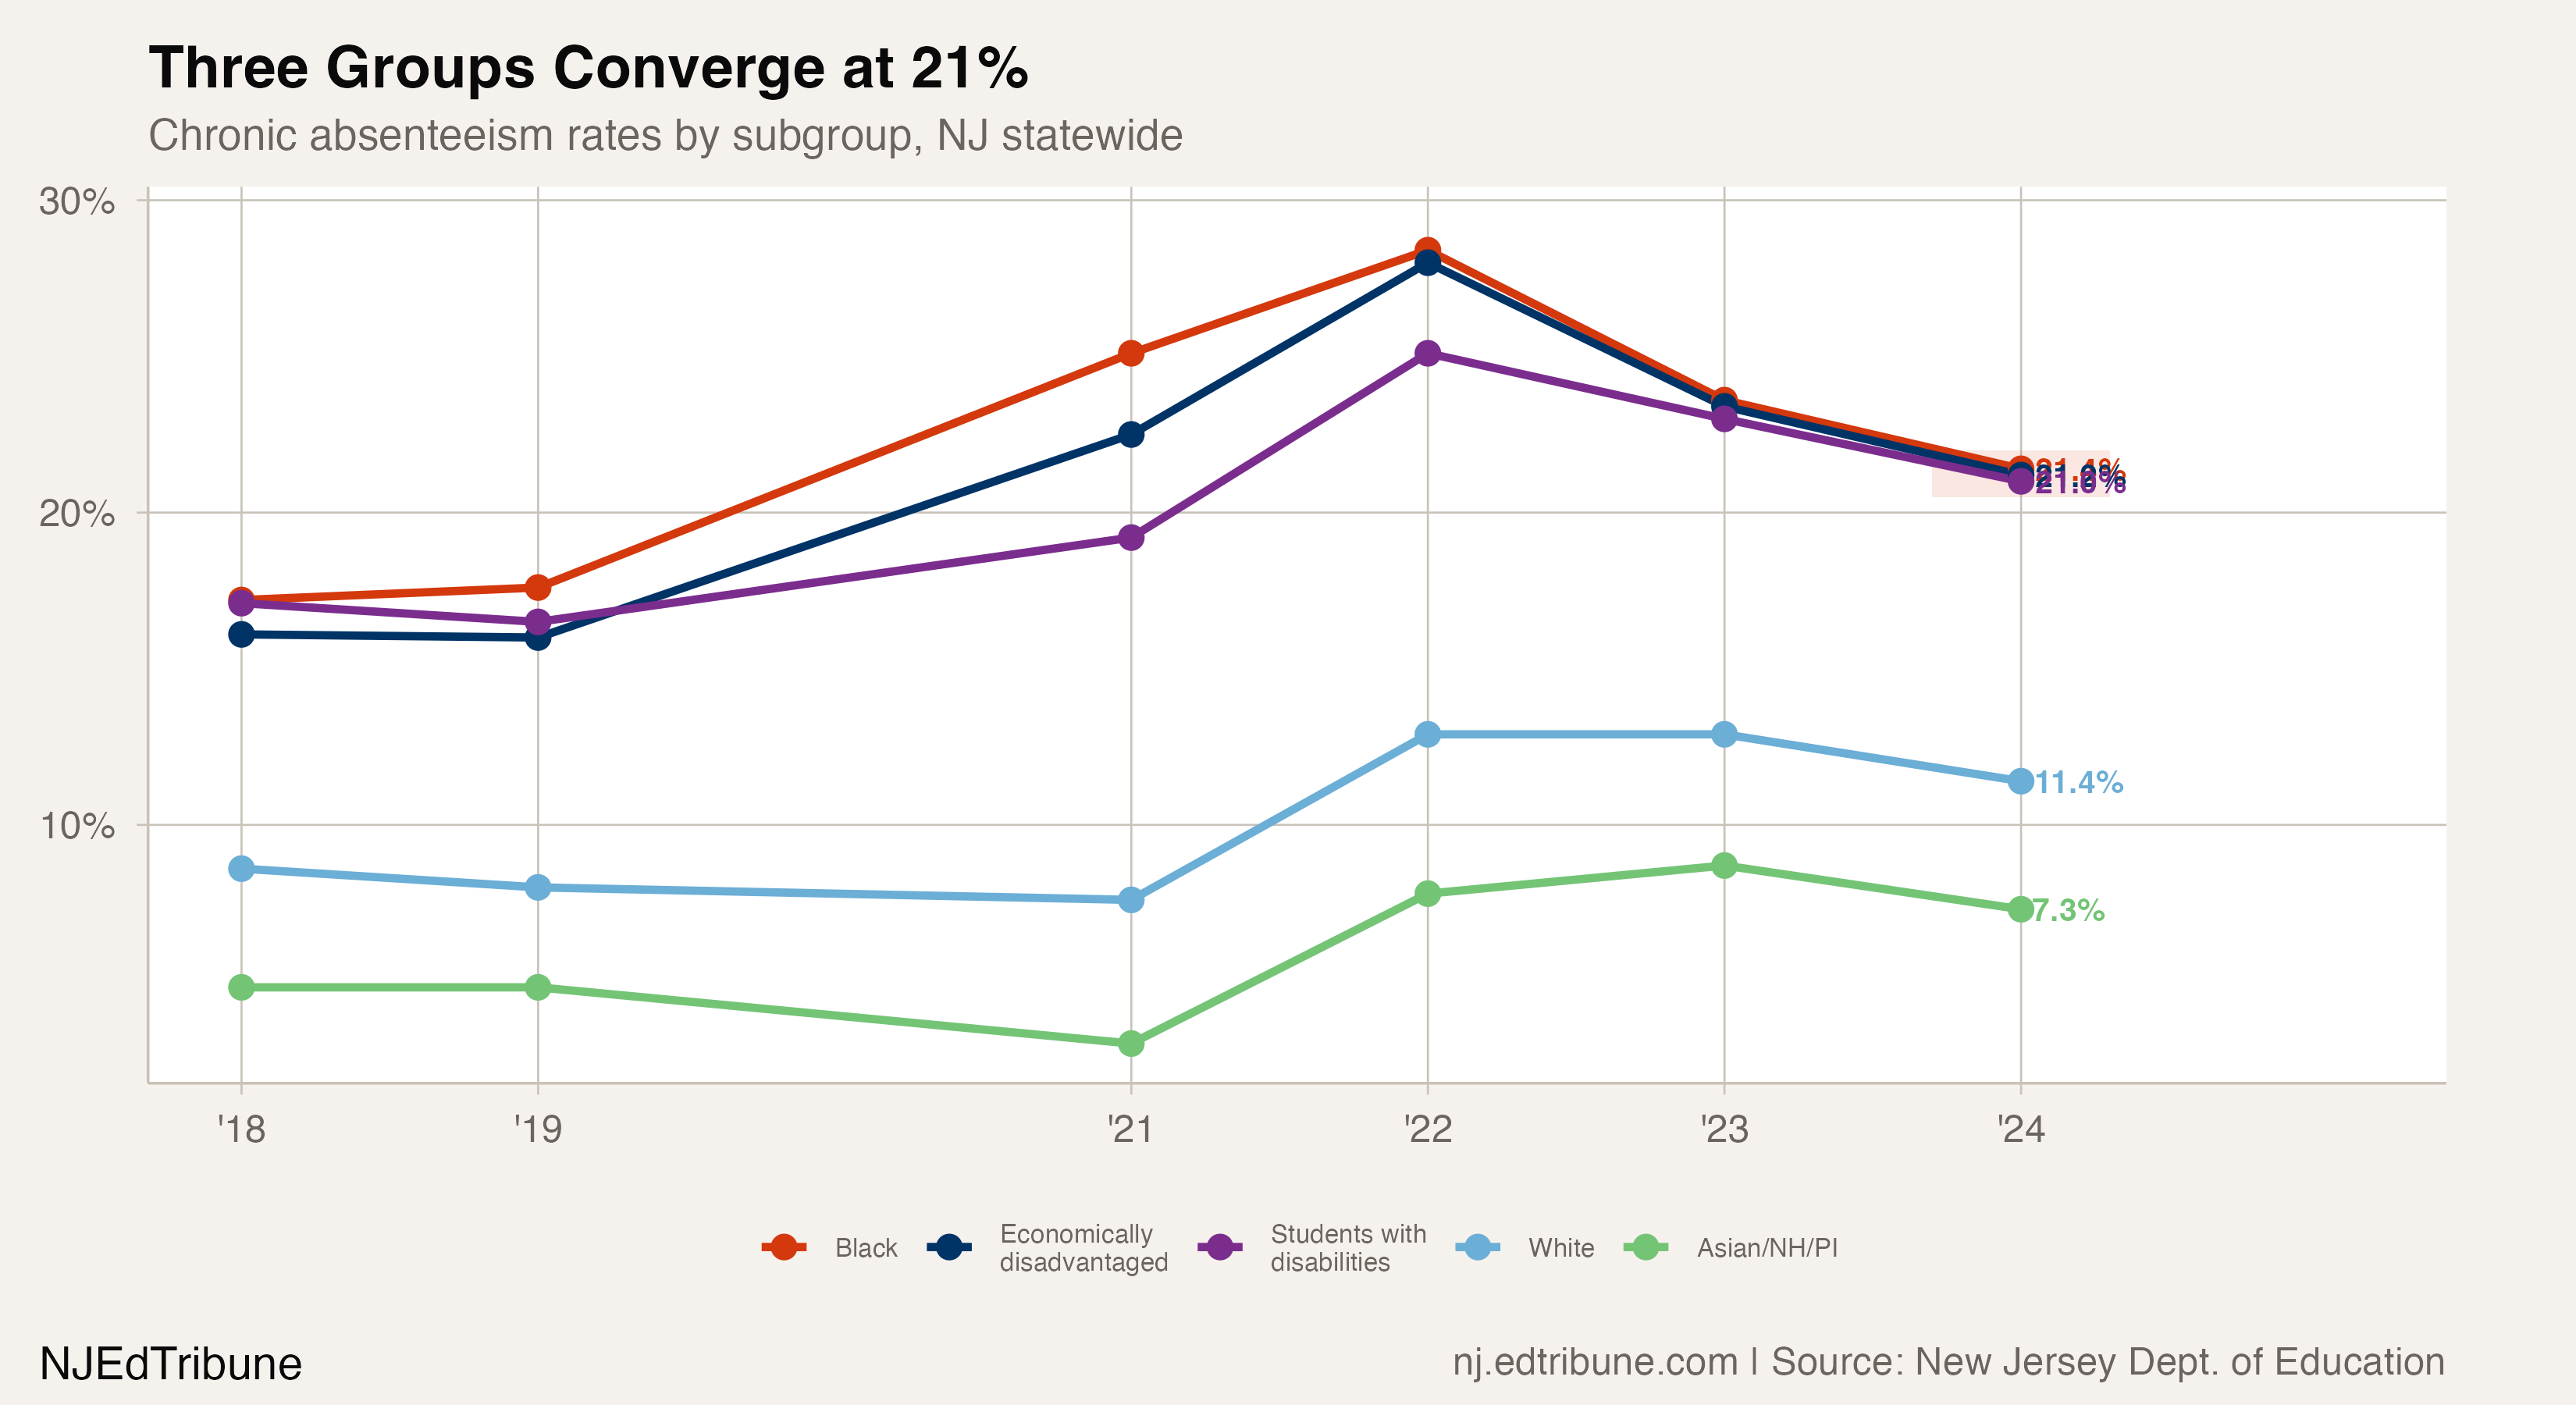
Compare that to the populations on the other side of the gap. White students sit at 11.4%, nearly half the rate of the convergence group. Asian, Native Hawaiian, and Pacific Islander students are at 7.3%, roughly a third. The statewide average, 14.9%, falls almost exactly in between.
A gap that widened, closed, and settled
The Black-white chronic absenteeism gap was 9.6 percentage points before the pandemic. It exploded to 17.5 points in 2020-21 and 15.5 points in 2021-22 as Black students' rates climbed faster. Two years of recovery brought it back to 10.0 points. That is not closure. That is a return to the pre-pandemic baseline, with both groups at higher absolute levels.
The economically disadvantaged-white gap followed a similar trajectory: 8.0 points in 2019, 14.9 in 2021, 9.8 in 2024. The disability-white gap was more stable, ranging from 8.5 to 11.6 points and settling at 9.6.
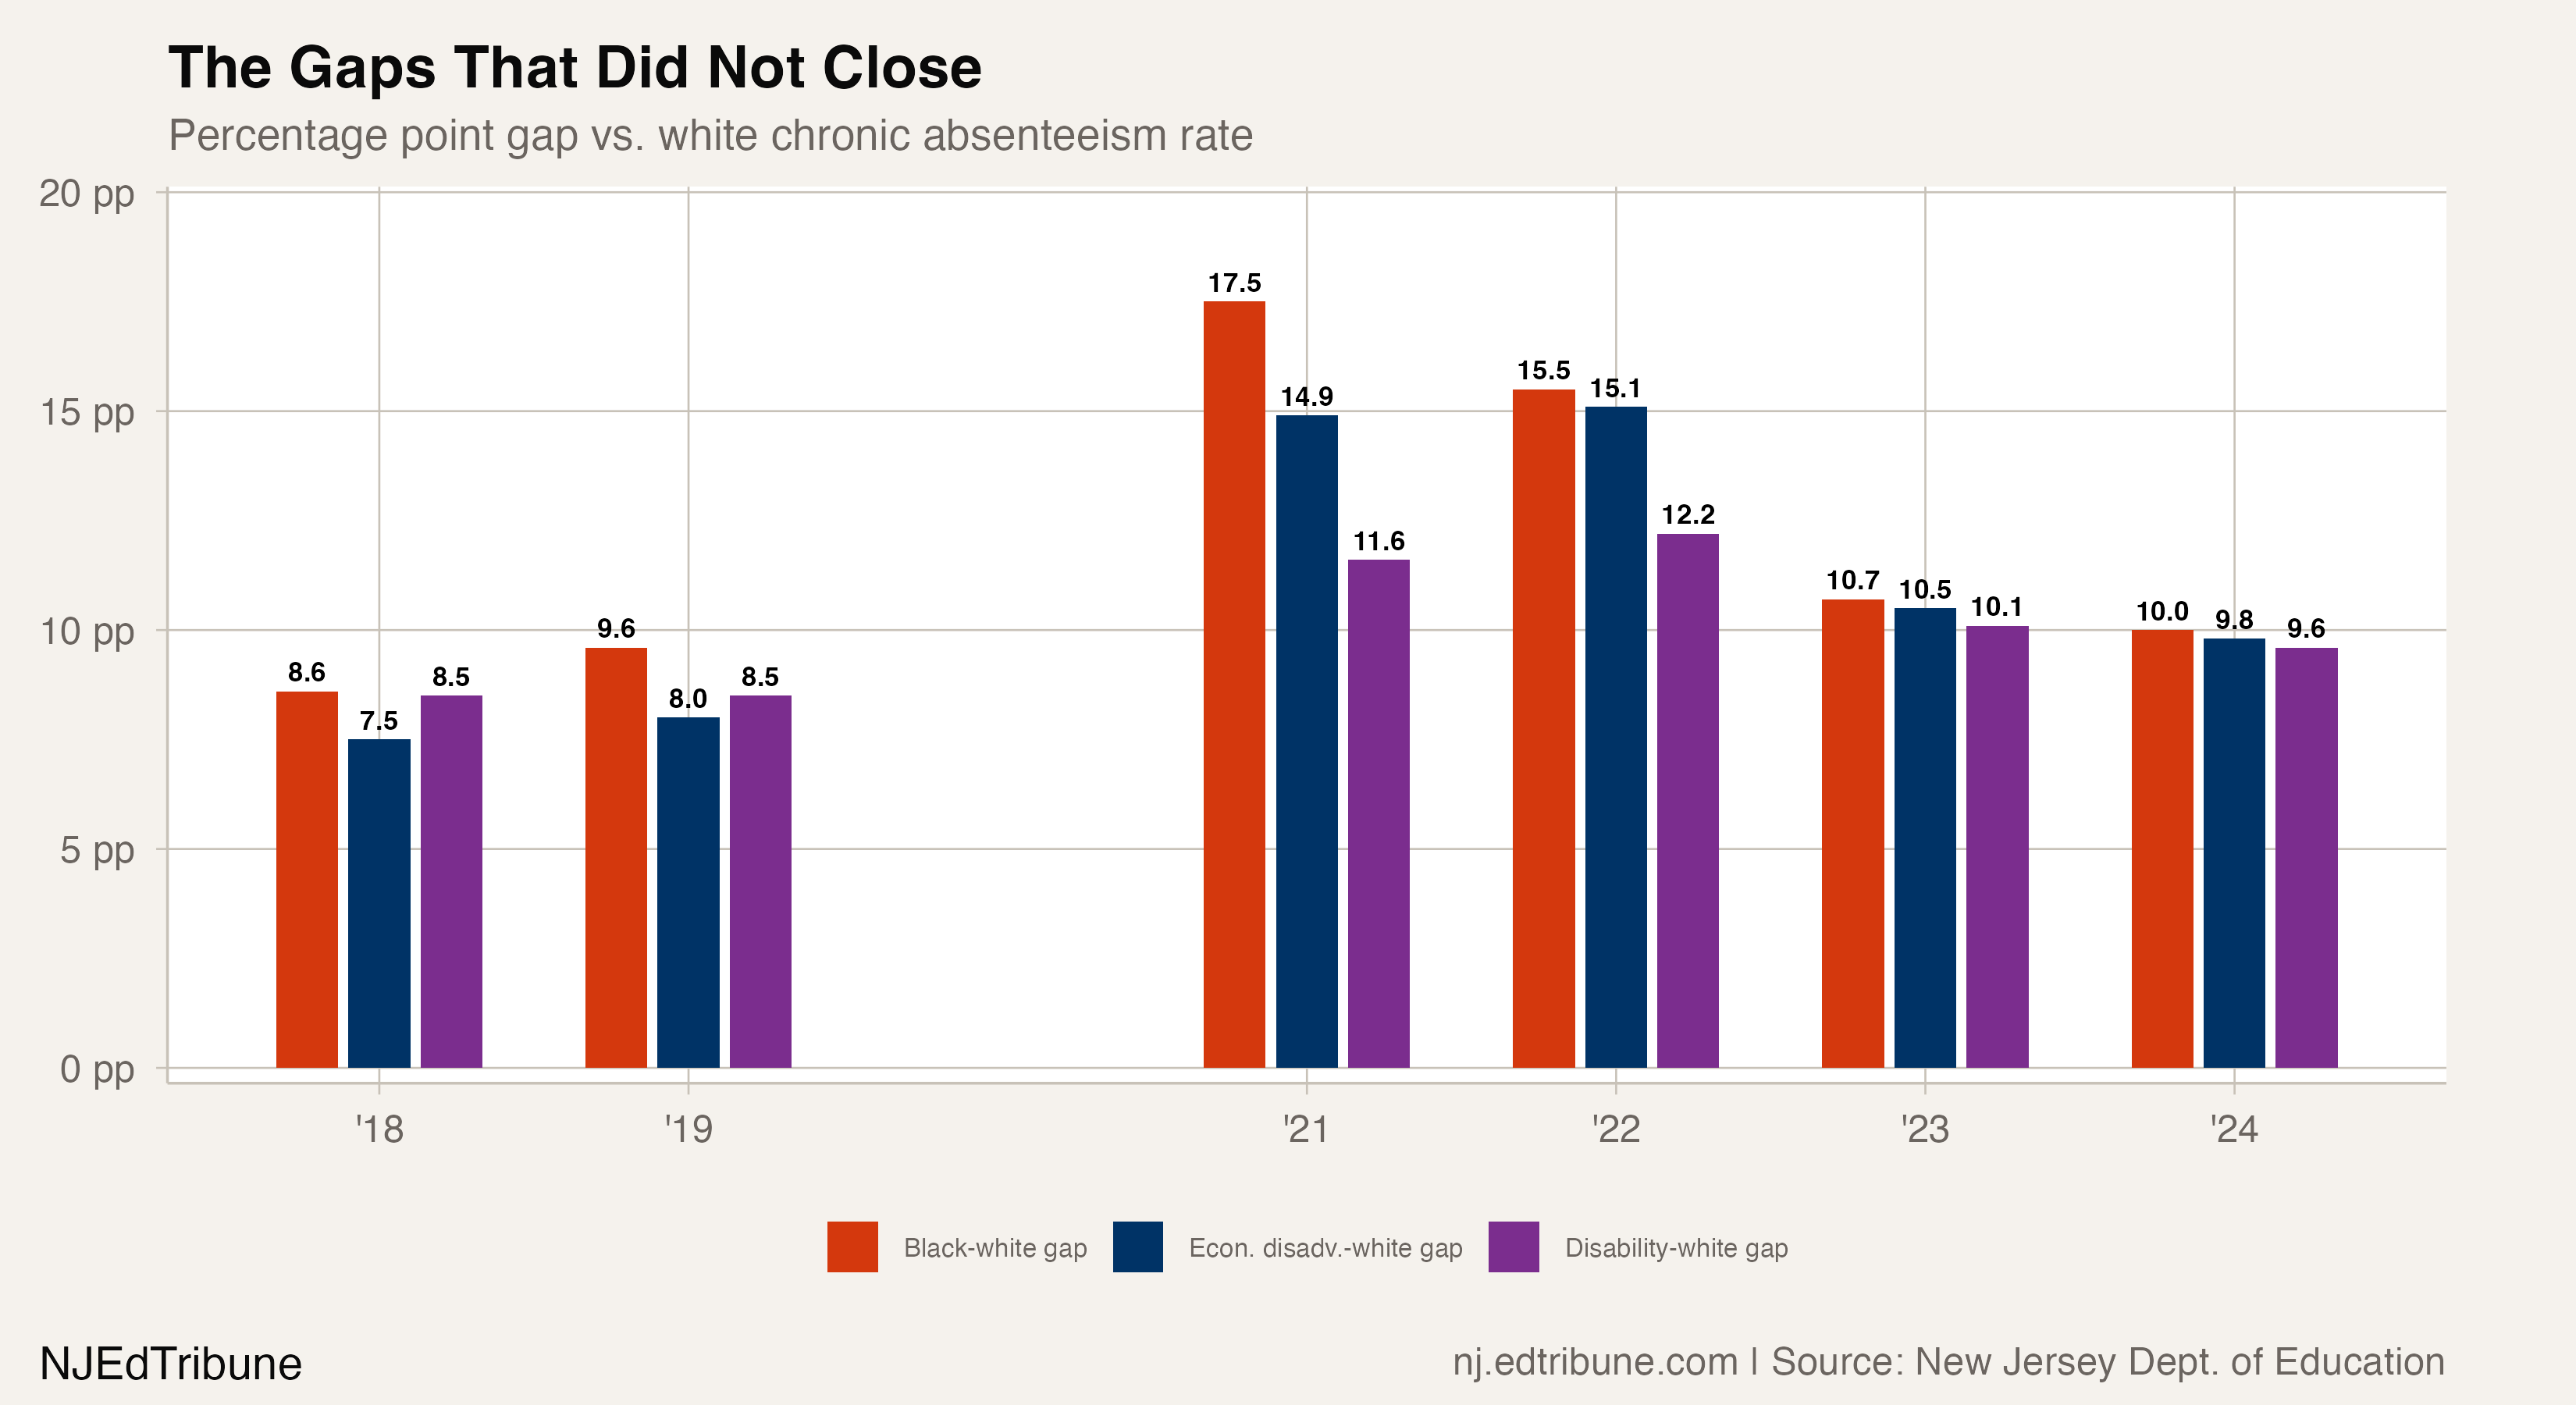
The pattern is consistent across all three comparisons. COVID did not create the gaps. It amplified them. The recovery narrowed them back to roughly where they started. The question is whether the current pace of improvement can push past this equilibrium.
The Rutgers State Policy Lab documented the same pattern, noting that New Jersey ranks second-lowest nationally in overall chronic absenteeism at 14.9%, but its Black student rate of 21.4% exceeds Alabama's 18.4%, despite Alabama having an overall rate nearly identical to New Jersey's. The report recommended that New Jersey study how Alabama and Virginia achieved lower chronic absenteeism among Black students and economically disadvantaged students while serving proportionally more of both.
Where the 21% lives
At the district level, the distribution of Black chronic absenteeism is enormous. In 30% of districts reporting Black student data, the rate exceeds 20%. In Camden, more than half of Black students are chronically absent. In Paterson, the Black rate of 45.9% is 10 points above even the district's overall rate of 35.7%, and the rate for Black students with disabilities reaches 42.4%, compounding two of the three convergence groups in a single population.
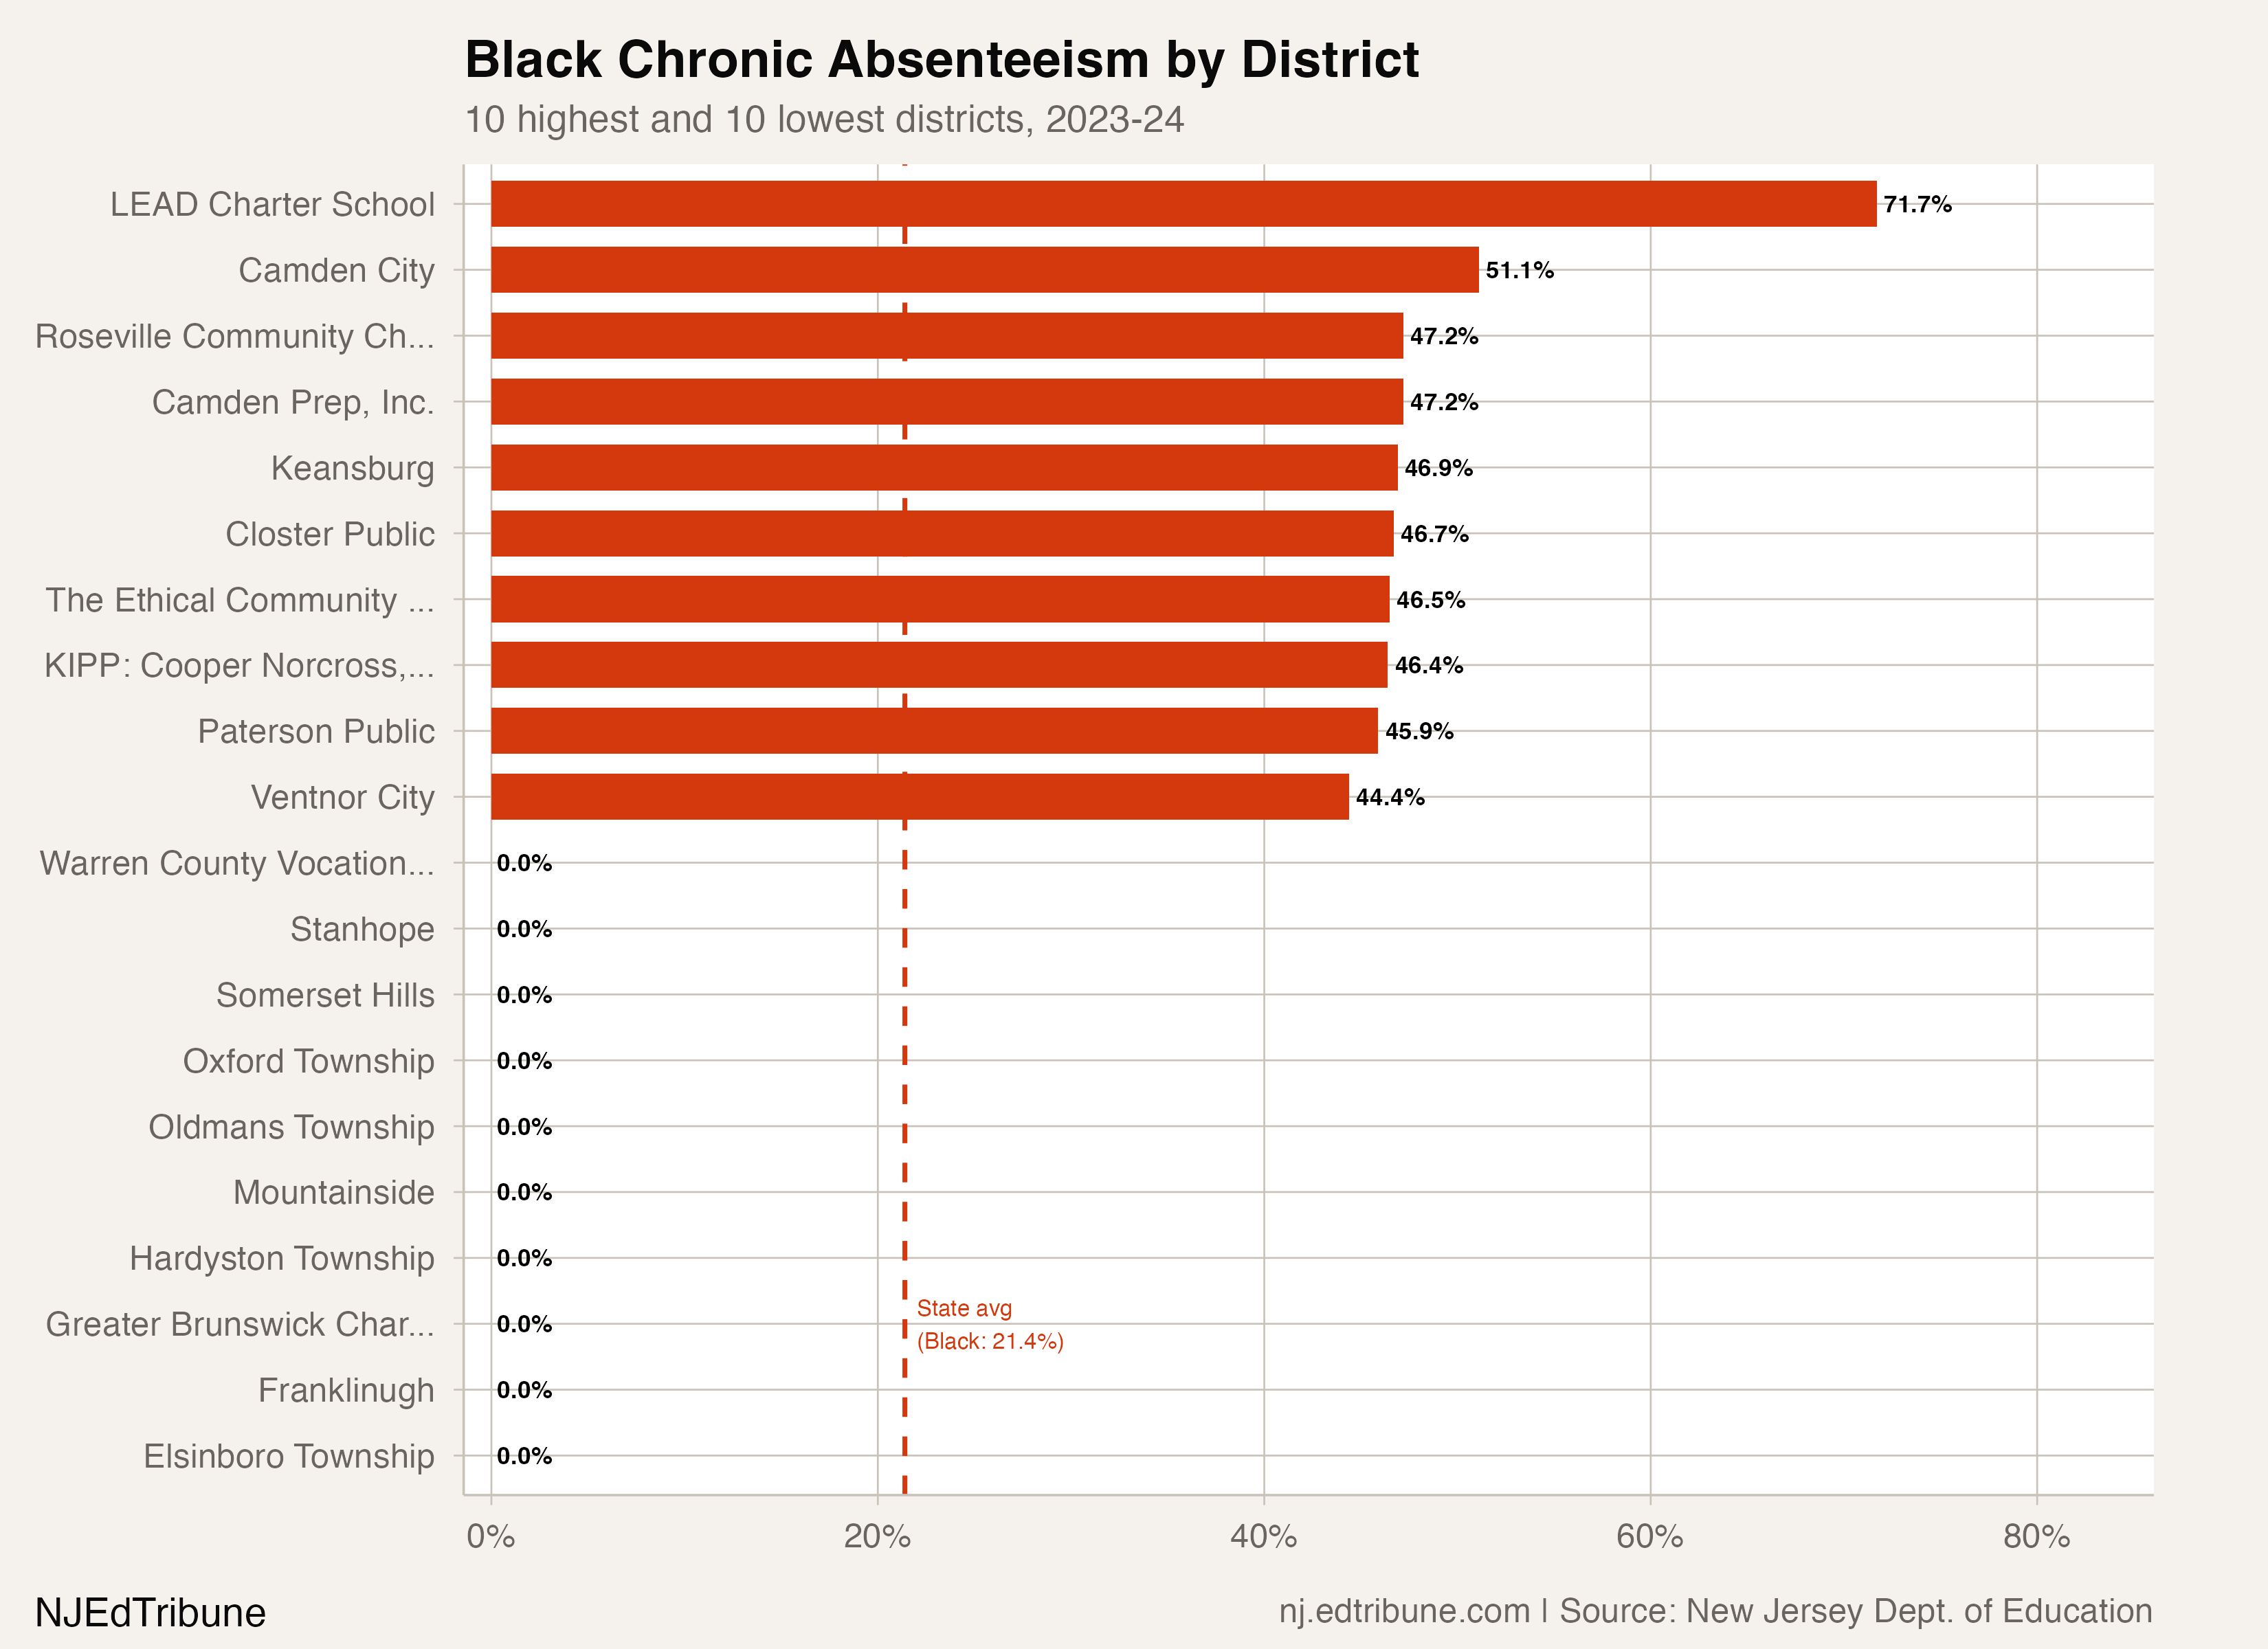
At the other extreme, dozens of small suburban districts report 0% Black chronic absenteeism: Mountainside, Stanhope, Somerset Hills. Many of these have small Black enrollments where a handful of students can swing the rate from zero to double digits in a single year. The state average is a midpoint between two realities that share little in common except a state boundary.
A 2022 study in Urban Education examined 132 schools in Passaic County and found that neighborhood-level resource deprivation and violent crime predicted chronic absenteeism trajectories across three school years. In Paterson, where 41% of children live below the poverty line and the median household income is $33,000 (less than half the state median of $71,180), the Child Opportunity Index averaged 11.4 out of 100, compared with 83.0 in neighboring Wayne. The researchers found that "greater neighborhood-level resource deprivation and neighborhood violent crime were associated with higher rates and trajectories of absenteeism."
The overlap between the convergence groups makes Passaic County's findings relevant beyond race. A student who is Black, economically disadvantaged, and receiving special education services in Paterson faces all three convergence barriers simultaneously. The 21% state average is, for that student, a floor far below the ceiling.
Recovery that left some groups further behind
Black students improved by 7.0 percentage points from their 2022 peak, the largest raw improvement of the three convergence groups. But Black students also peaked highest and started highest. In absolute terms, Black chronic absenteeism in 2024 (21.4%) remains 3.8 points above the 2019 rate of 17.6%, the smallest remaining elevation of the three groups.
Economically disadvantaged students are 5.2 points above pre-COVID. Students with disabilities are 4.5 points above. Hispanic students are 5.3 points above their pre-COVID rate. The statewide average is 4.3 points above. White students are 3.4 points above.
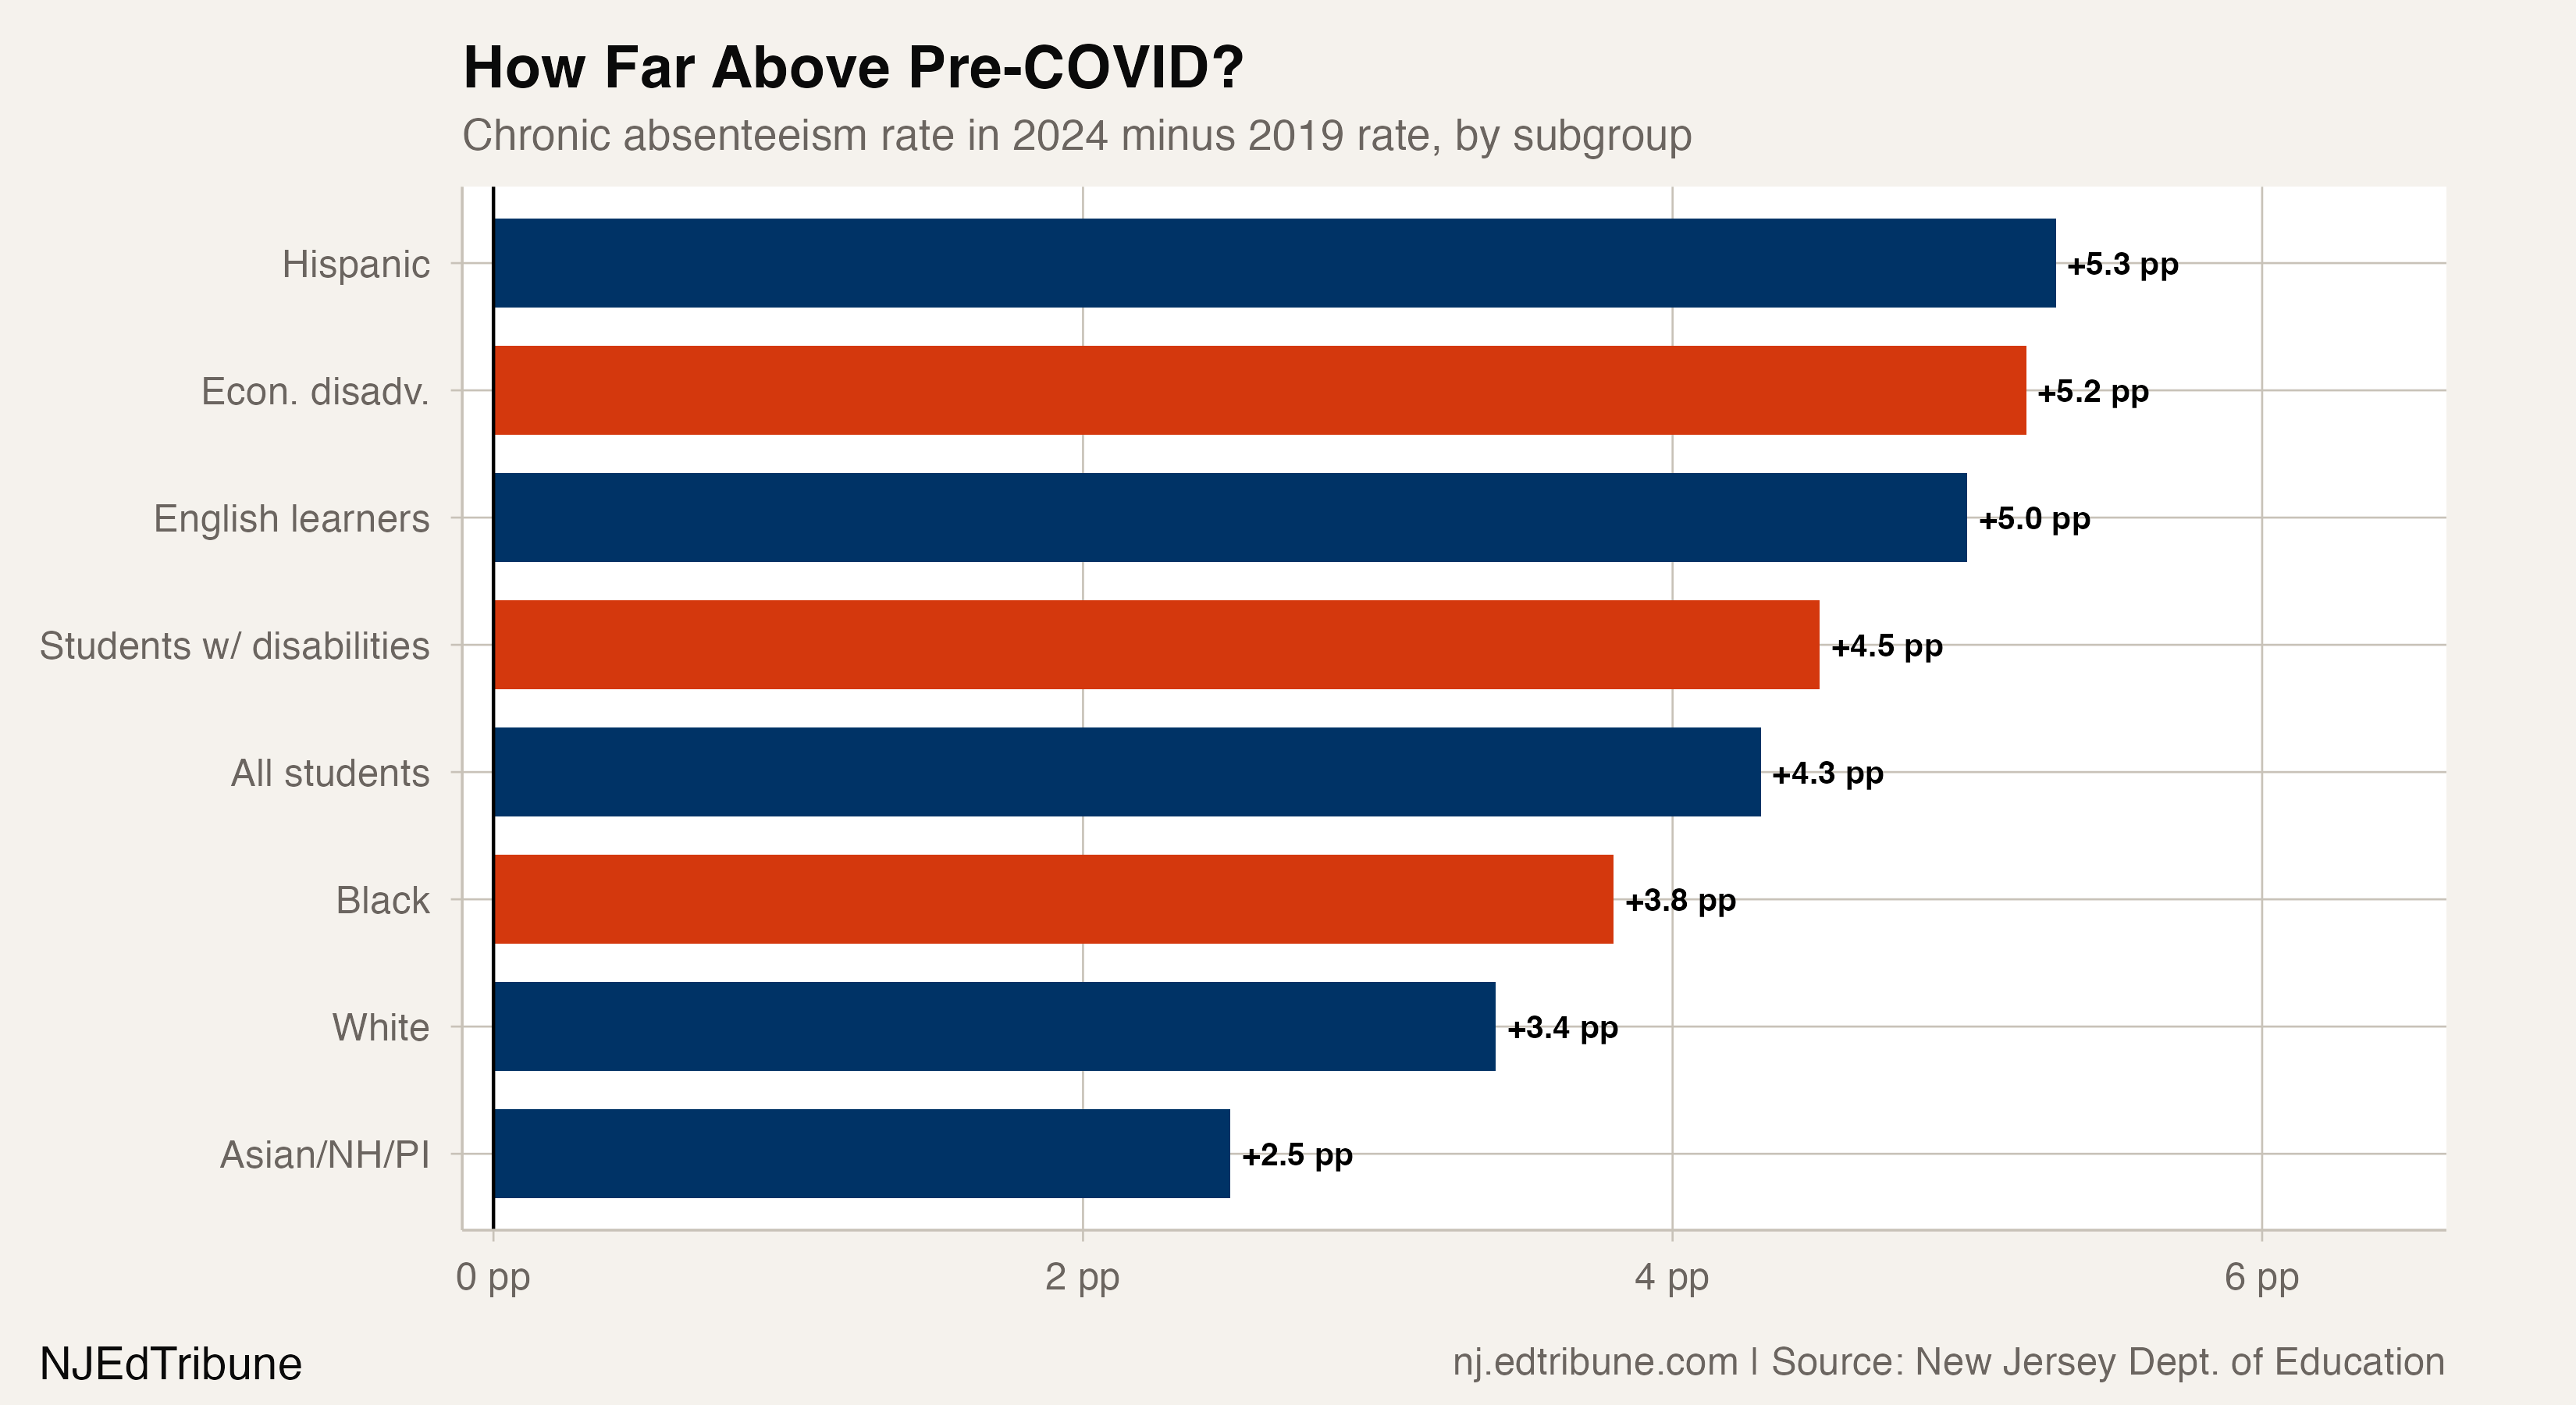
The ordering is instructive. Black students recovered the most from the peak but started from a higher pre-COVID baseline, so they had less distance to fall. Economically disadvantaged students had the farthest to go and have not closed much of the remaining gap. Students with disabilities improved the least from peak and remain nearly as far from their pre-COVID rate as economically disadvantaged students.
At the district level, the story is bleaker. Among districts with comparable data in both years, 77.9% of districts have a higher Black chronic absenteeism rate in 2024 than in 2019. For economically disadvantaged students, that figure is 84.8%. For students with disabilities, 80.1%. The statewide improvement is real, but it is concentrated in a minority of districts. Most districts are still worse off for these populations than they were before the pandemic.
What the 21% floor may be made of
The New Jersey School Boards Association categorizes chronic absence barriers into four domains: structural barriers beyond a student's control (transportation, housing instability, neighborhood violence), aversion to school (anxiety, depression, unidentified disabilities), disengagement (unwelcoming climate, bullying, culturally unresponsive instruction), and misconceptions about the importance of daily attendance.
For the three convergence groups, the most plausible explanation for their shared floor is that they share the same structural barriers. Economically disadvantaged students disproportionately face unreliable transportation, unstable housing, and health access problems. Students with disabilities face health appointments, condition-related absences, and higher suspension rates: nationally, 13% of students with disabilities receive out-of-school suspensions, more than double the rate for students without disabilities. Black students in New Jersey are overrepresented in both other groups.
The convergence at 21% may mark the point where attendance interventions aimed at behavior and engagement, such as mentoring programs and positive messaging, have extracted their gains, and the remaining barriers are material: a parent who cannot get off work to drive a child with a disability to school; a family doubling up in housing with an unreliable bus route; a teenager responsible for younger siblings in a household without childcare.
New Jersey's policy response is arriving. Lt. Gov. Tahesha Way signed S3776 in December 2025, creating a 17-member Chronic Absenteeism Task Force charged with identifying root causes, examining disparities among vulnerable subgroups, and reporting recommendations within a year. A companion bill would require any district with chronic absenteeism above 10% to establish an Attendance Review Team.
Whether the task force's mandate can reach the material barriers will determine whether the 21% ceiling becomes a way station or a permanent address. Nelida Valentin of the Princeton Area Community Foundation told Chalkbeat the key is to "help strengthen and connect what is happening on the ground" with budget priorities. The NJ4S mental health program served 281,972 people with Tier 1 services in 2024-25, an 18% increase, but its $43 million budget focuses on prevention and brief intervention, not the material barriers that define the convergence group's shared floor.
What comes next
The 21% convergence is not a starting point. It is a landing after two years of decline from pandemic highs. The next year of data will test what the convergence means.
If the three lines separate -- Black students dropping faster than students with disabilities, or economically disadvantaged students plateauing while the other two keep falling -- it will suggest that different interventions are reaching different populations at different speeds. The convergence was a coincidence of timing, not a shared barrier.
If they stay locked together at 21%, or drift down in lockstep to 19% or 18%, the structural floor hypothesis gains weight. Three populations with different demographics but overlapping material conditions -- unreliable transportation, unstable housing, health access gaps -- would be revealing that the barrier is not race or disability or poverty individually. It is what all three share underneath.
Detailed code that reproduces the analysis and figures in this article is available exclusively to EdTribune subscribers.
Discussion
Sign in to join the discussion.
Loading comments...