In this series: New Jersey 2023-24 Chronic Absenteeism.
At Paterson's↗ET School 6, more than half of all students were chronically absent in 2023-24. A reporting investigation found that the school, along with several neighbors, had not filed a corrective action plan since 2021-22, despite state requirements for districts above 10%.
School 6 is an extreme case. But the district-wide numbers tell a version of the same story, and the sharpest version belongs to Paterson's Black students.
45.9%
That is the chronic absenteeism rate for Black students in Paterson in 2023-24. Nearly one in two missed 18 or more school days. Before the pandemic, the rate was 35.2% -- already more than double the statewide average for all students. COVID pushed it to 59.0% in 2021-22. Two years of recovery have brought it down, but not nearly enough.
The total district rate followed a similar arc: 27.6% before the pandemic, 49.6% at peak, 35.7% now. The difference is that Black students started higher, climbed higher, and have come back less.
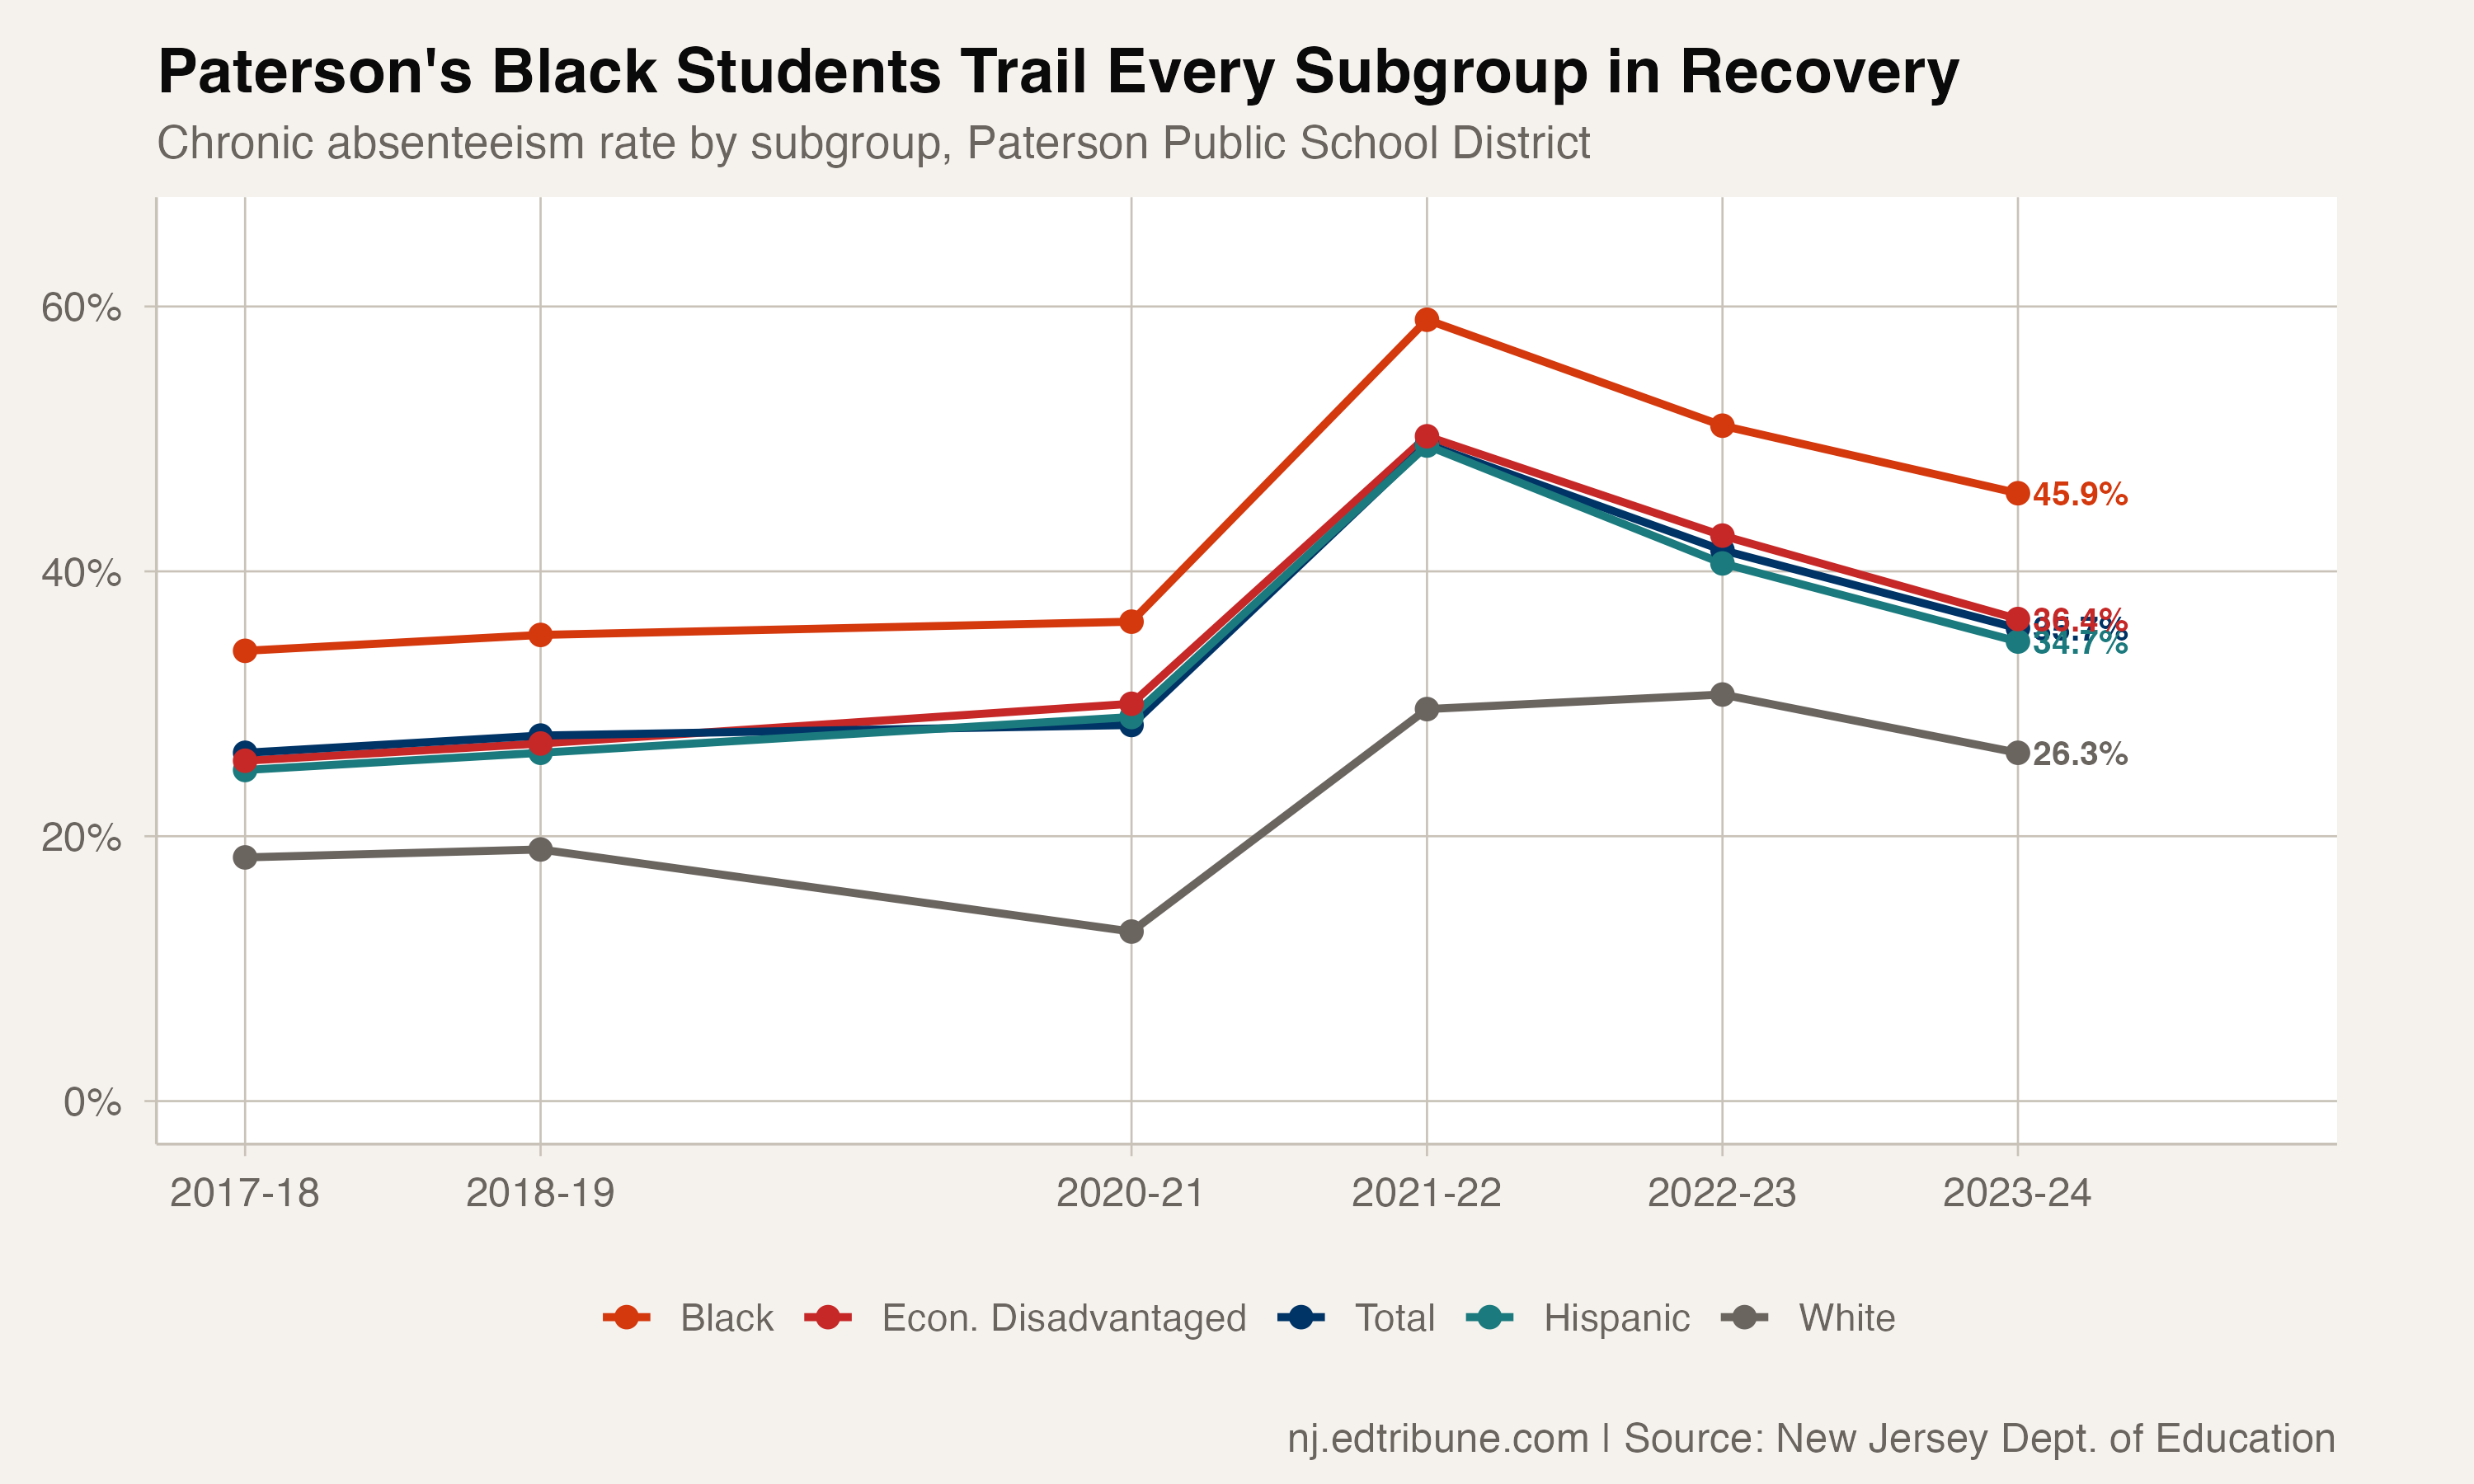
Hispanic students, who make up the majority of Paterson's enrollment, have recovered 63.8% of their pandemic increase, falling from 49.5% to 34.7%. The overall rate has recovered 63.2%. Black students have recovered just 55.0%, leaving them 10.7 percentage points above their own pre-pandemic baseline.
The gap within the gap
Every subgroup in Paterson runs far above state averages. But the internal disparities matter too.
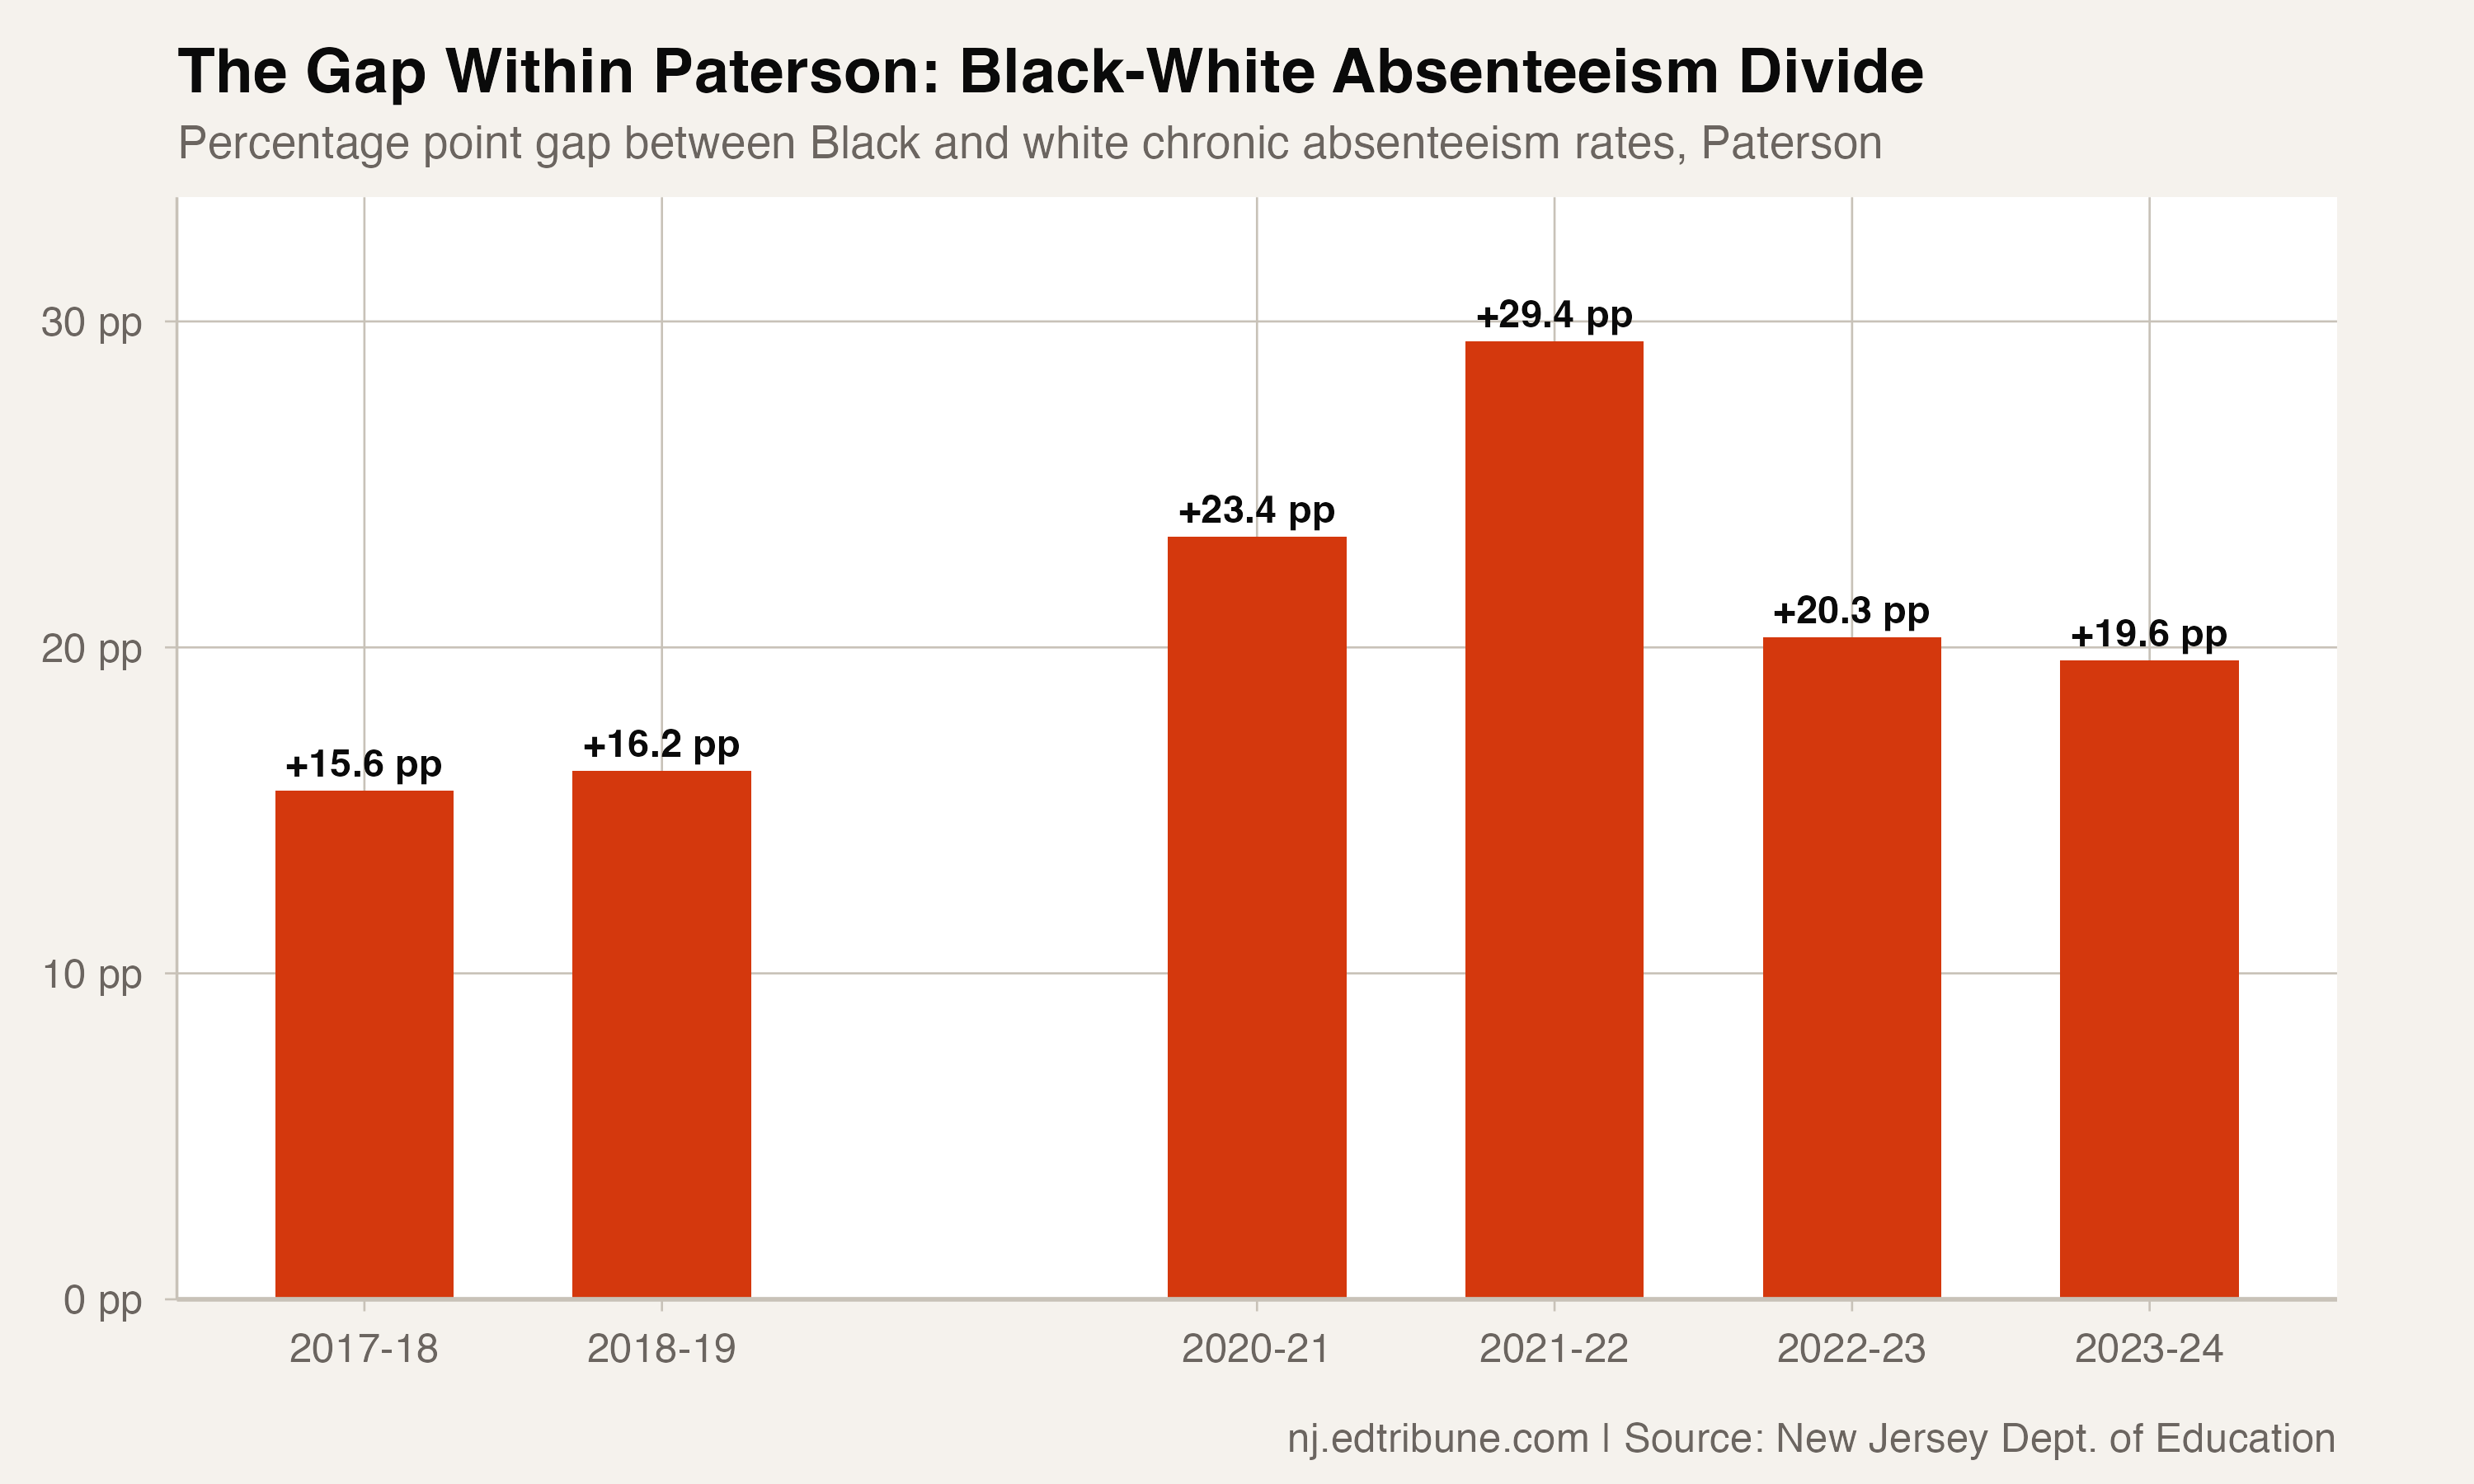
The Black-white chronic absenteeism gap within Paterson was 16.2 percentage points before COVID. It blew out to 29.4 points at the pandemic peak in 2021-22, when 59.0% of Black students and 29.6% of white students were chronically absent. The gap has narrowed since then, but at 19.6 points in 2023-24, it remains wider than it was before the pandemic.
White students in Paterson are having their own attendance crisis -- 26.3% chronically absent is more than double the statewide white rate of 11.4%. But white students have recovered the least of any subgroup: just 37.6% of the way back from their peak. Their chronic rate actually got worse from 2021-22 to 2022-23, climbing from 29.6% to 30.7% before declining. For Black students, recovery has been slow. For white students in Paterson, it barely started until last year.
Four times the statewide white rate
Paterson's Black chronic rate of 45.9% is exactly four times the statewide white rate of 11.4%. That ratio has been remarkably stable: it was 4.4x before the pandemic, peaked at 4.8x in 2020-21, and has settled back to 4.0x.
The stability of that ratio is, in its own way, damning. It means the structural forces that produce the gap -- concentrated poverty, housing instability, inadequate transportation, health care access -- have not changed.
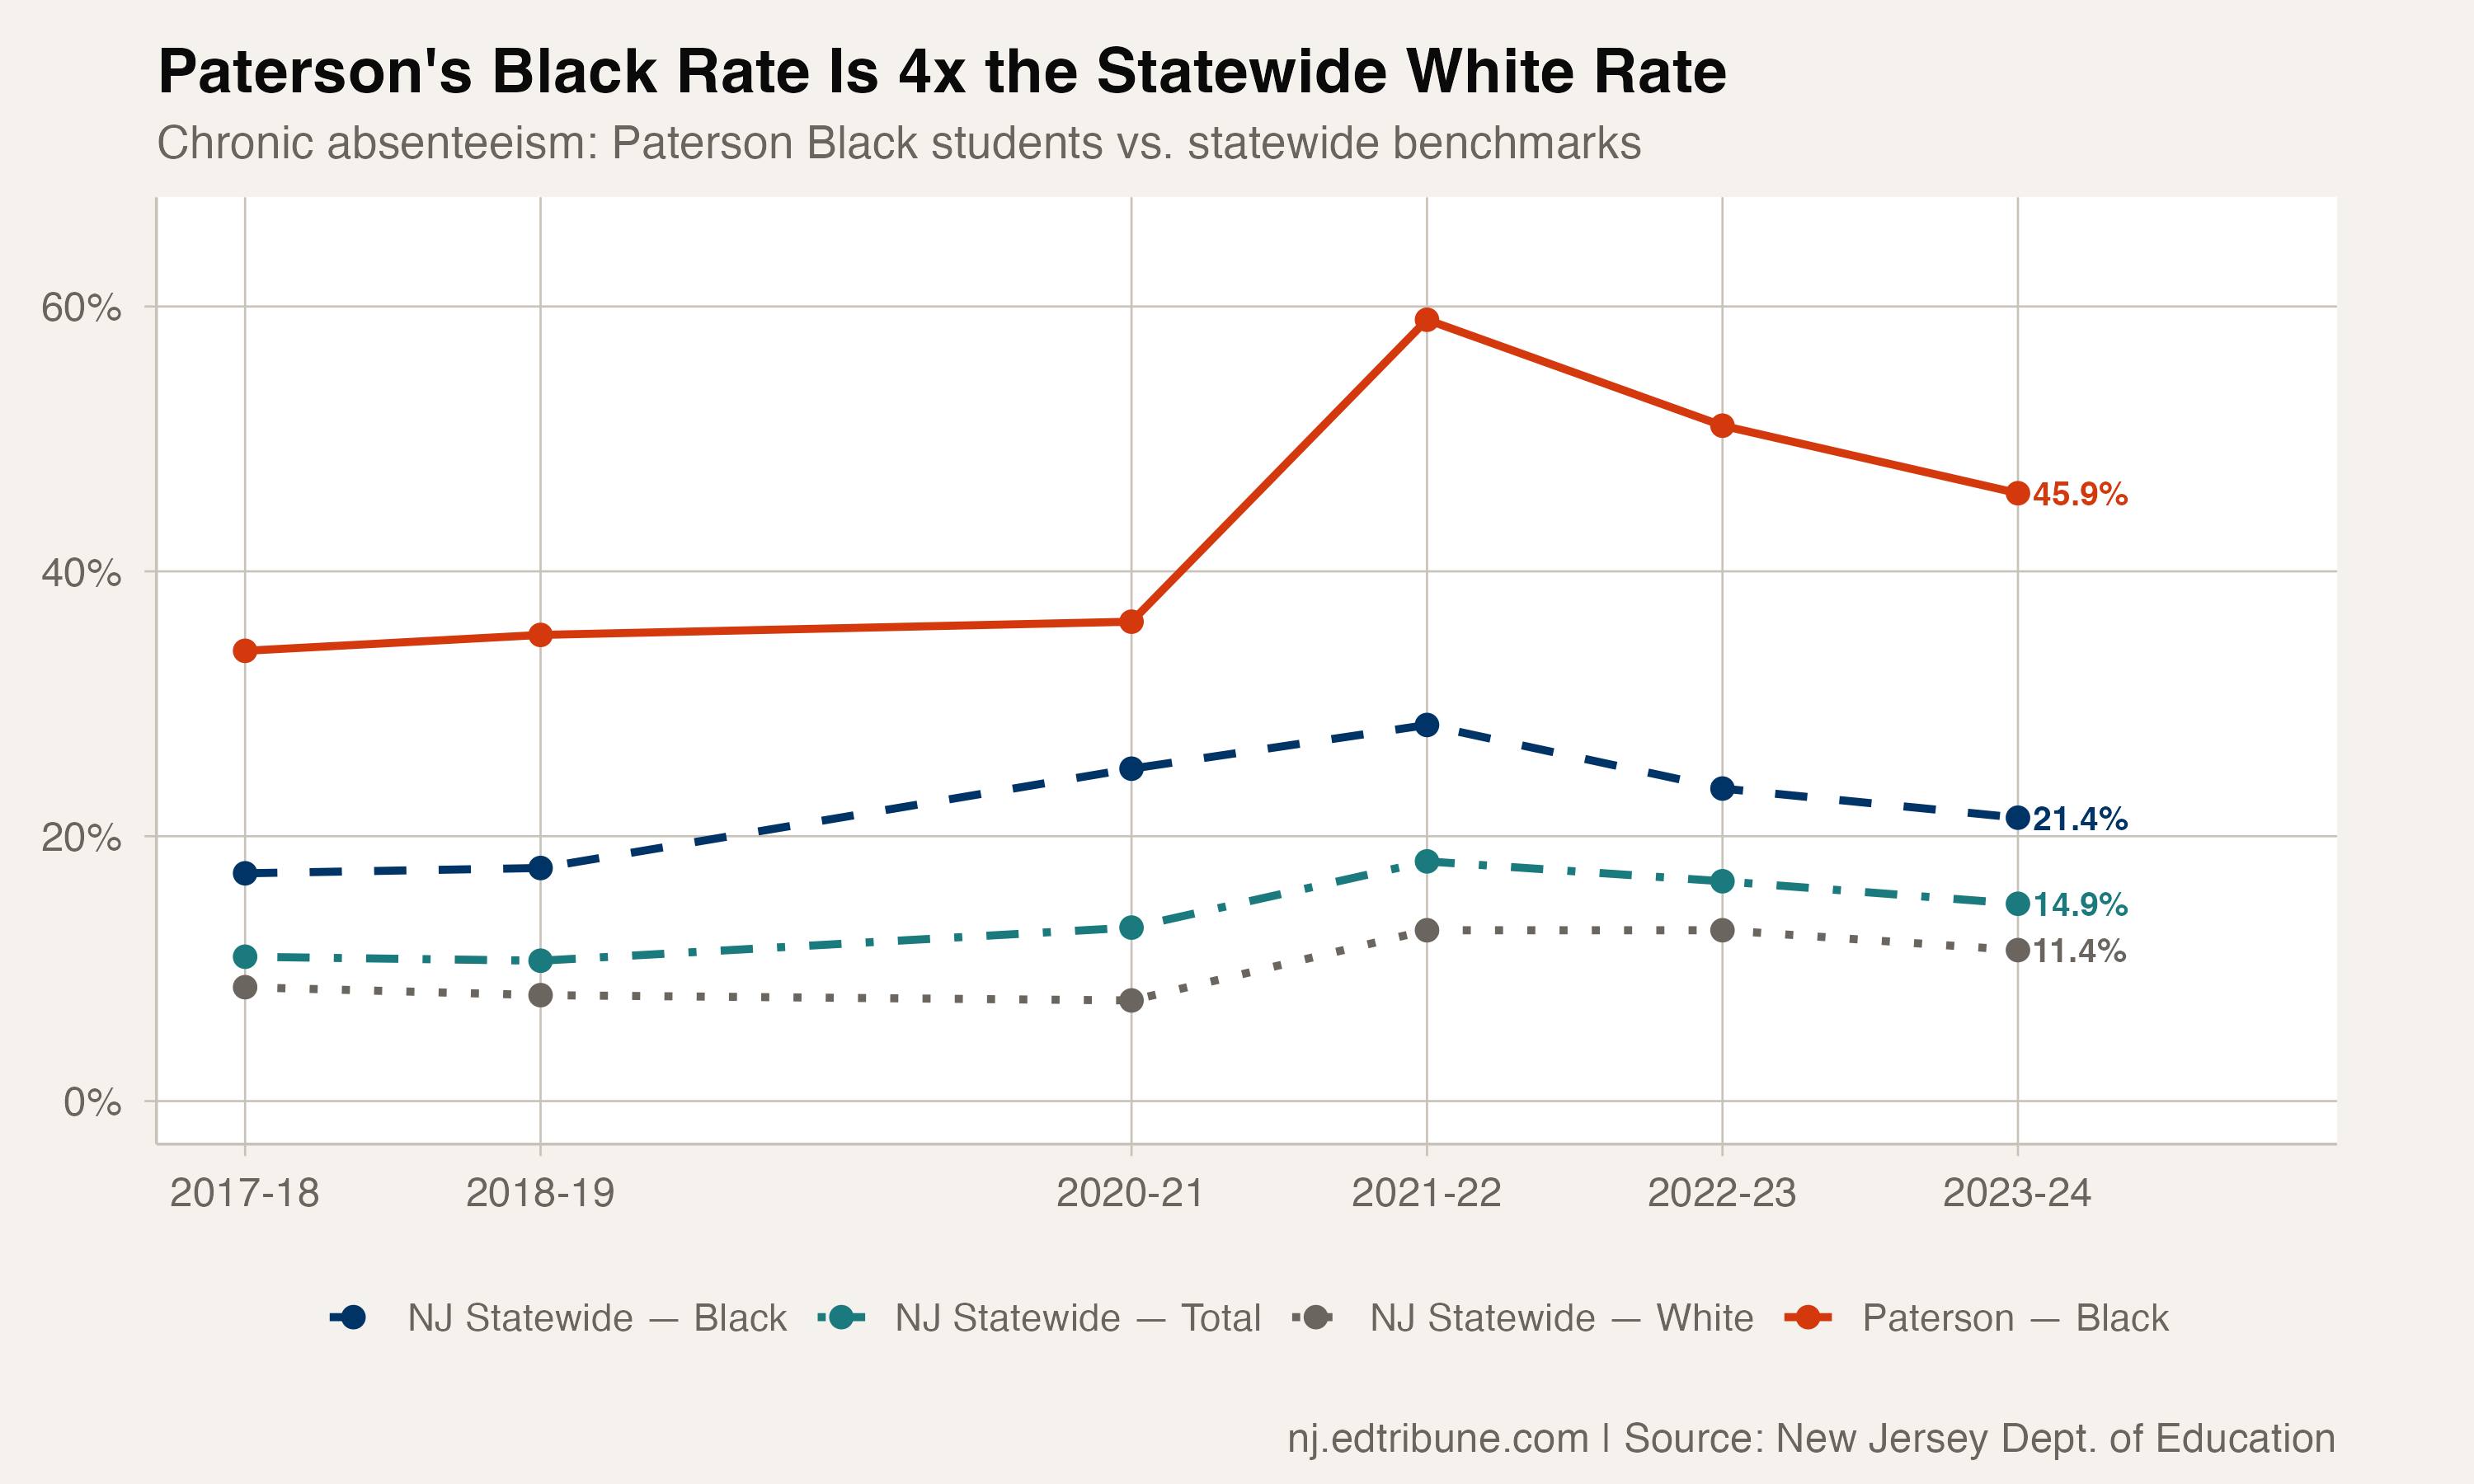
Paterson's Black rate also runs far above the statewide Black rate of 21.4%. The gap between Paterson's Black students and Black students statewide was 17.6 points before COVID. It exploded to 30.6 points at peak. At 24.5 points in 2023-24, it has closed somewhat but remains nearly 7 points wider than it was before the pandemic.
The most vulnerable
Chronic absenteeism in Paterson climbs further at every layer of disadvantage. Students experiencing homelessness hit 64.1% in 2023-24, up from 52.0% pre-COVID. Students in foster care reached 45.2%. Students with disabilities: 42.4%, up from 33.9%.
Economically disadvantaged students, a category that covers the vast majority of Paterson's enrollment, sat at 36.4% -- 9.4 points above their pre-COVID rate and barely distinguishable from the district's overall 35.7%.
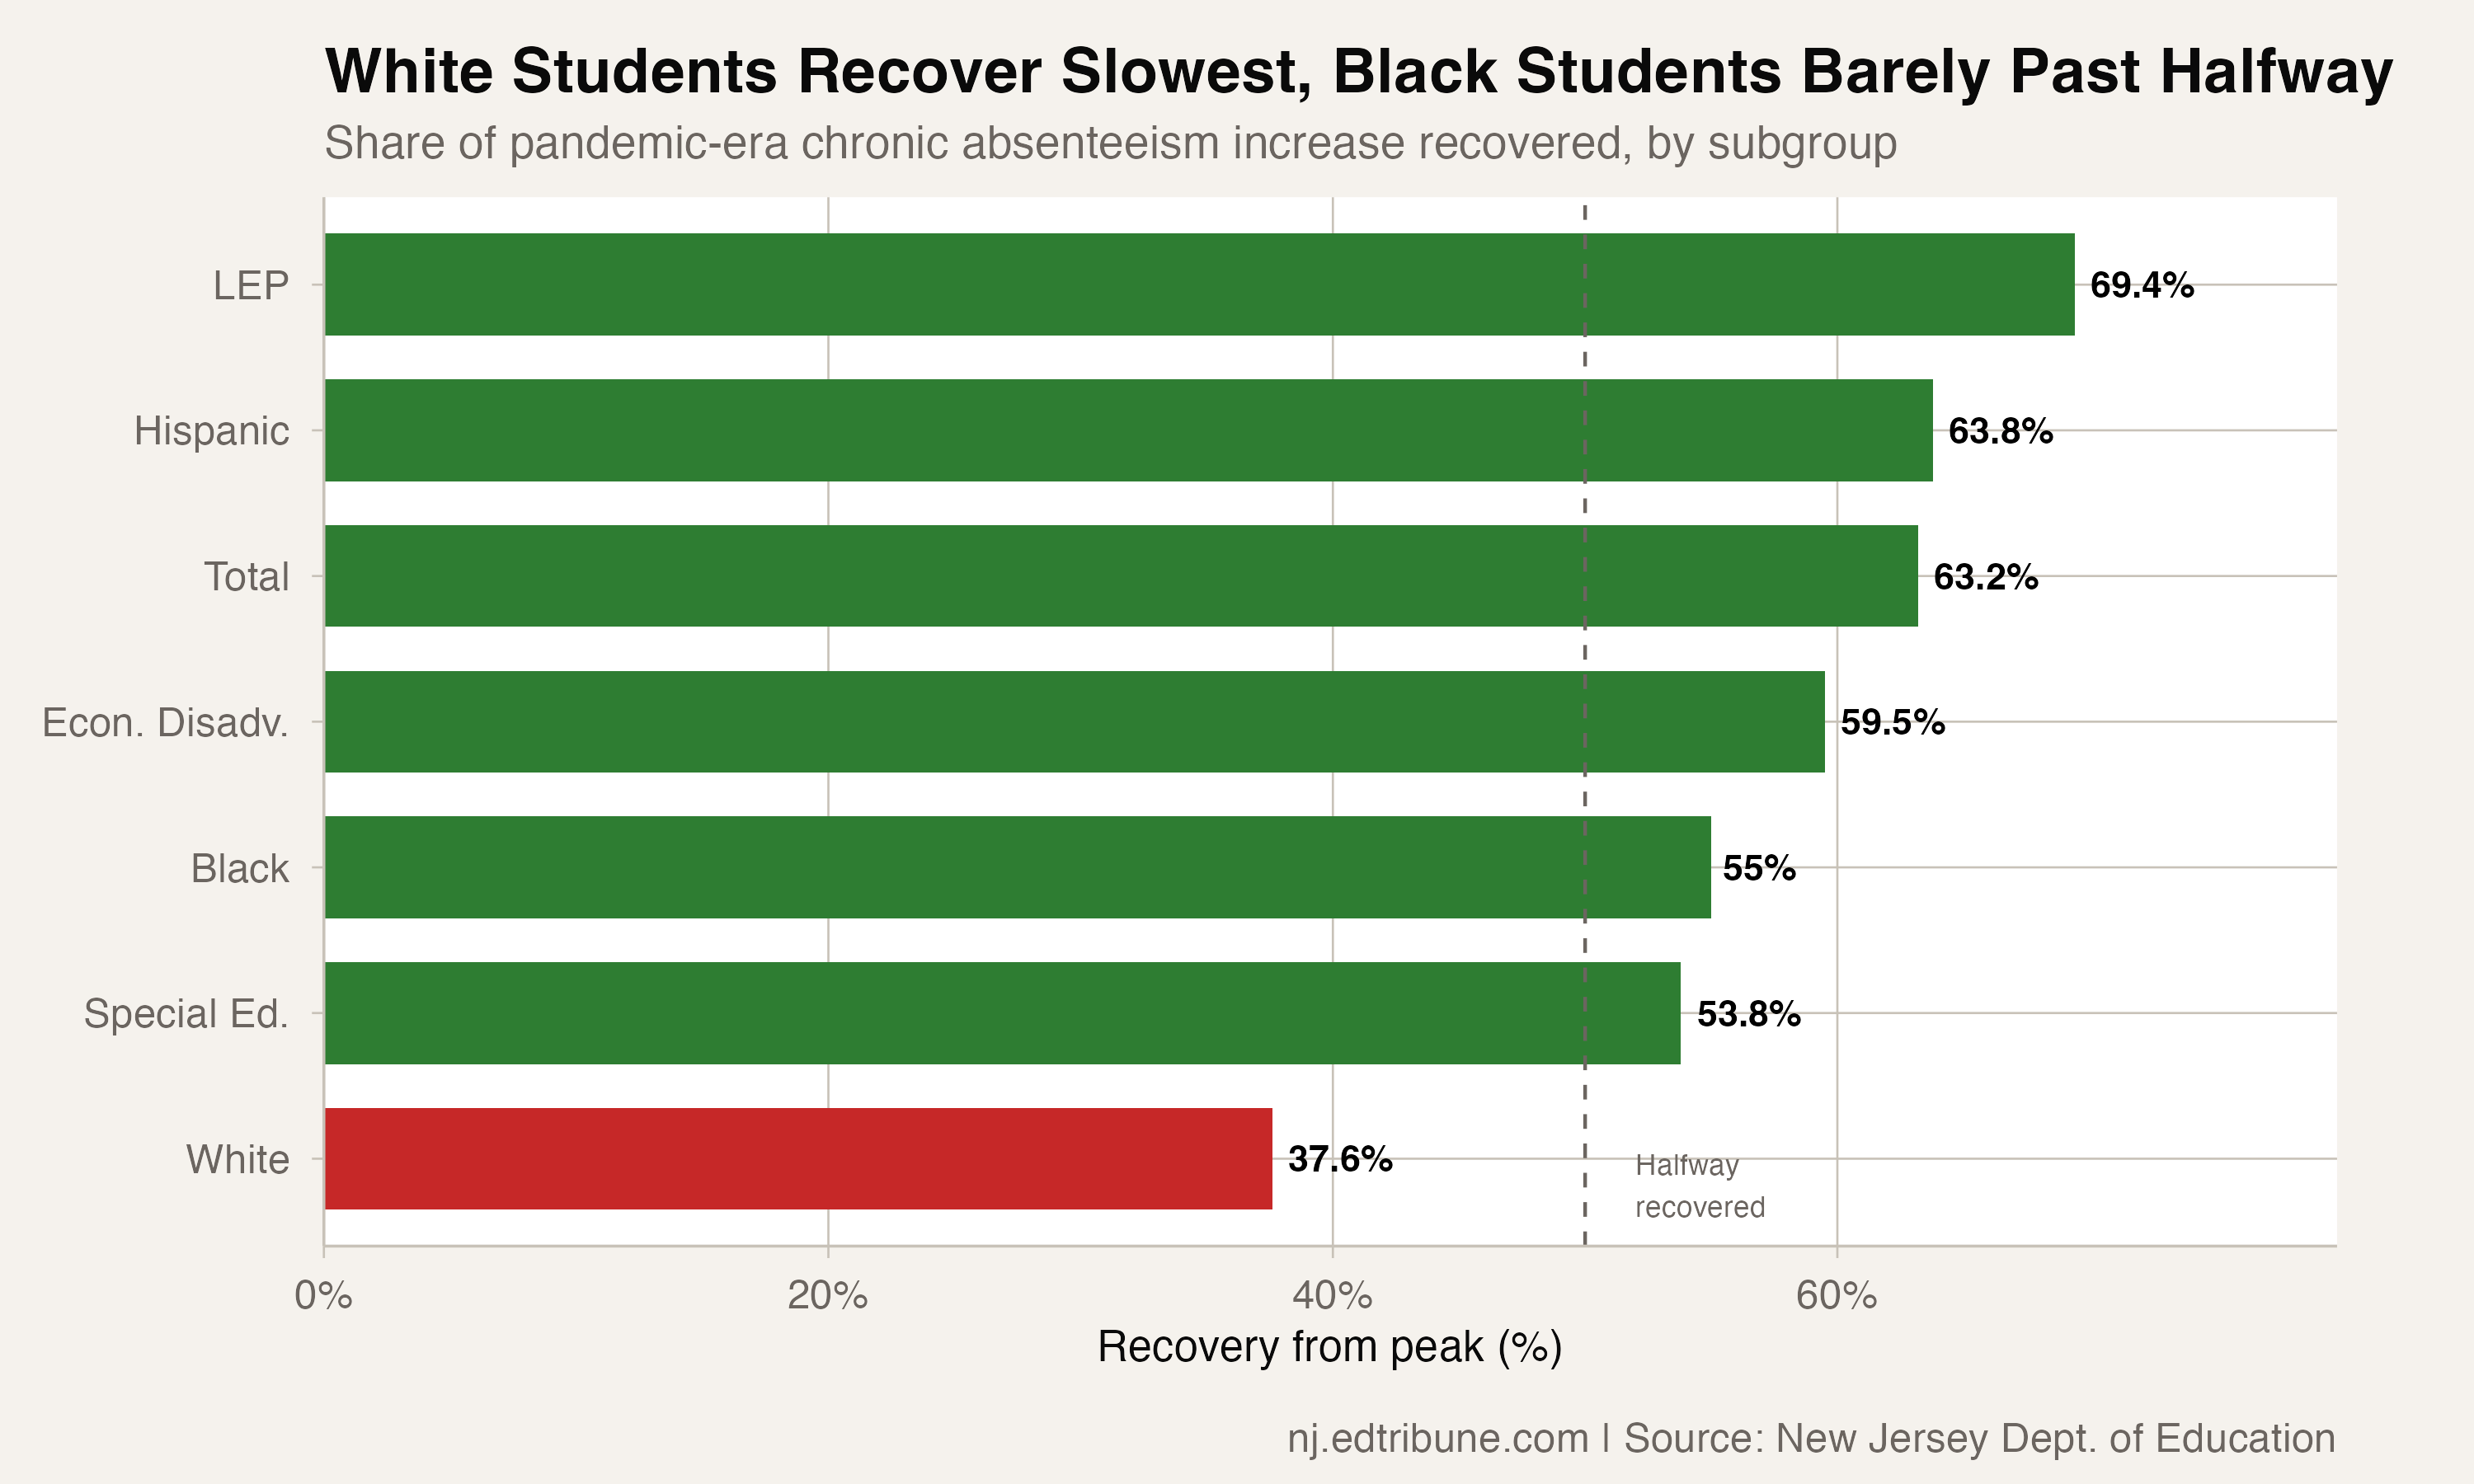
The recovery picture is uneven. English learners have recovered the most (69.4% of their pandemic increase), followed by Hispanic students (63.8%) and the overall rate (63.2%). Black students (55.0%) and students with disabilities (53.8%) have barely crossed the halfway mark. White students, at 37.6%, are the furthest behind, though their lower absolute rate means the raw numbers are smaller.
Newark went the other direction
The comparison that should keep Paterson administrators up at night is 30 miles east on Route 80.
Newark's Black chronic absenteeism rate was 35.3% in 2018-19 -- essentially identical to Paterson's 35.2%. By 2023-24, Newark had driven its Black rate down to 14.9%. Paterson's was 45.9%. A gap of 1 point became a gap of 31.
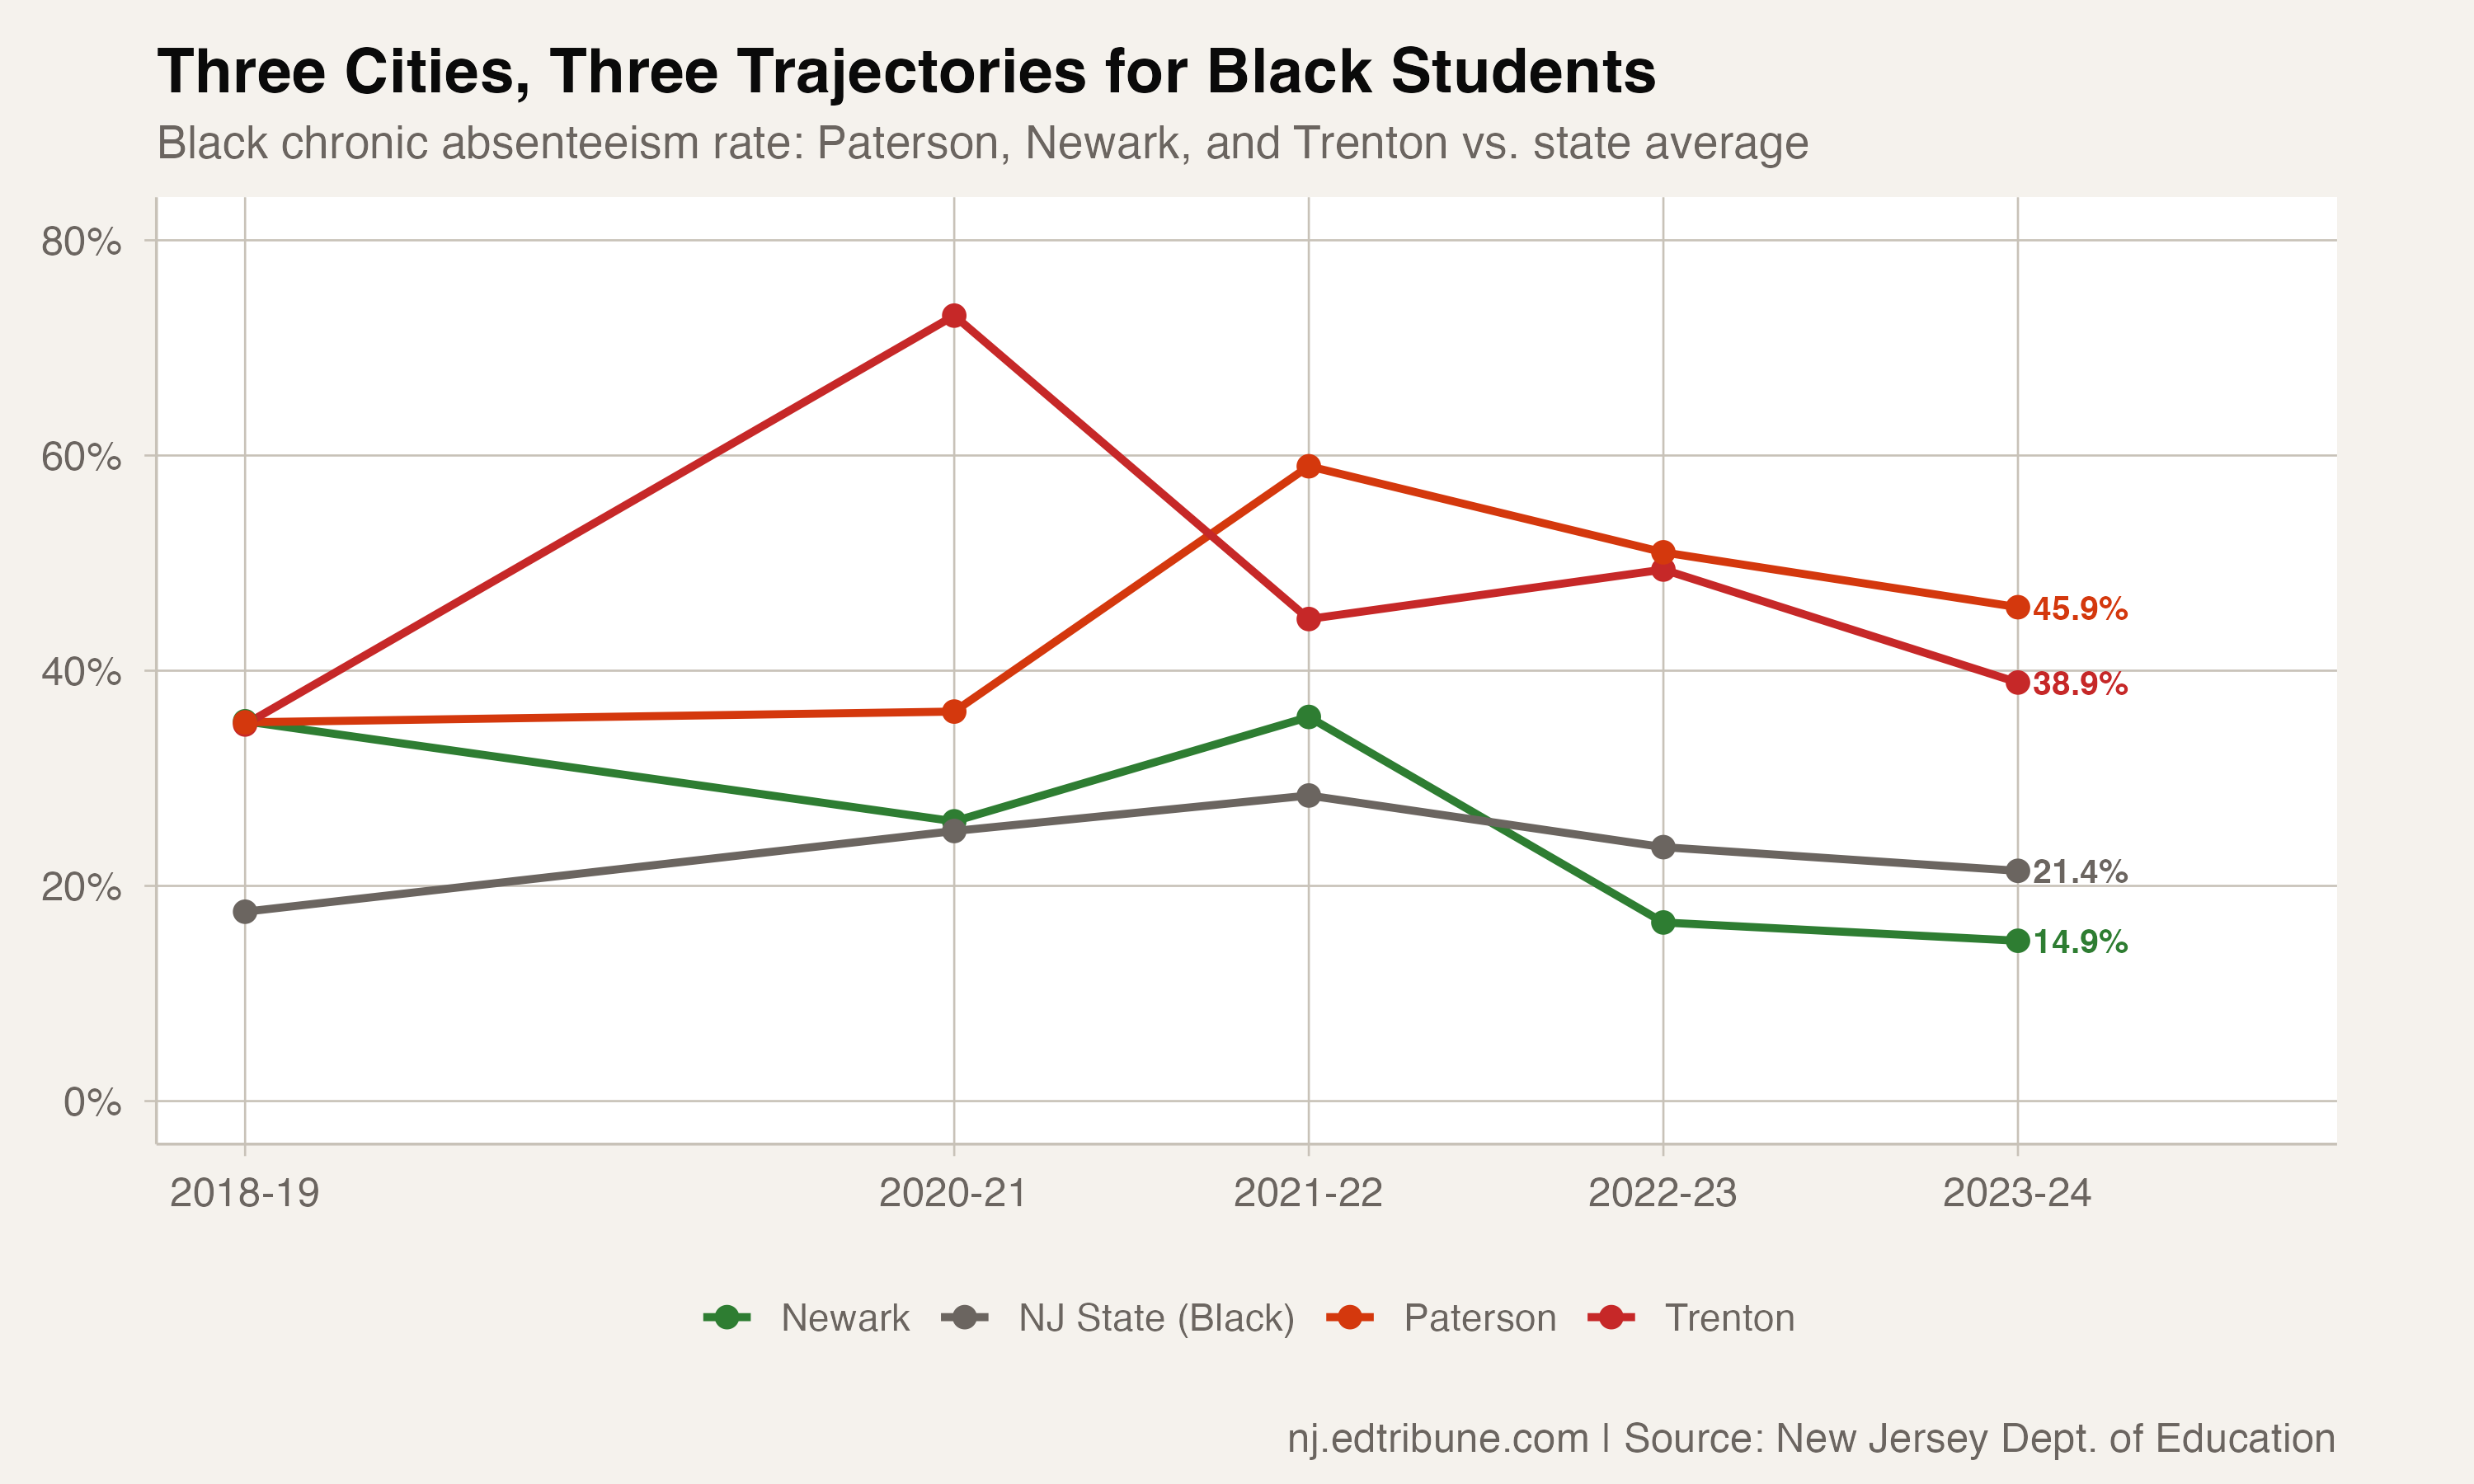
Trenton's trajectory has been wilder -- its Black rate spiked to 73.0% in 2020-21 before settling to 38.9% -- but it too has recovered more of its pandemic increase than Paterson. Newark is the outlier: a district with comparable poverty and demographics that cut chronic absenteeism for Black students by more than half in five years, using attendance counselors, a truancy task force, and systematic family engagement.
Whether Newark's approach is replicable in Paterson is an open question. Newark had years of state intervention that built certain institutional capacities. Paterson's challenges include a 44.5% foreign-born population, families who travel internationally during the school year, and what district officials have described as "menstrual poverty" -- girls missing school because they cannot afford basic hygiene products.
What is being done
Paterson hired chronic absenteeism specialists in 2018, and the district uses compulsory attendance specialists to follow up with students. But the state data suggests these interventions have not yet bent the curve for the students who need them most.
New Jersey's funding structure creates a distinctive dynamic. Unlike California, Texas, and many other states, New Jersey funds schools based on enrollment, not average daily attendance. Paterson does not lose per-pupil revenue when students miss school. The financial pressure to chase attendance is indirect. The academic consequences are not.
In 2018-19, Newark's Black chronic absenteeism rate was 35.3%. Paterson's was 35.2%. Five years later, Newark's is 14.9%. Paterson's is 45.9%. Same state, similar demographics, comparable poverty rates, 30 miles apart on Route 80, and a 31-point gap in outcomes for Black students. Whatever Newark did that Paterson did not, it produced one of the starkest divergences in attendance equity anywhere in the country.
Detailed code that reproduces the analysis and figures in this article is available exclusively to EdTribune subscribers.
Discussion
Sign in to join the discussion.
Loading comments...