College Achieve Greater Asbury Park Charter School has a chronic absenteeism rate of 1.1%. LEAD Charter School's rate is 71.4%. Both are New Jersey charter schools. Both numbers appear in the same state database. And both get averaged together to produce a single statistic that is supposed to tell us something meaningful about charter school attendance.
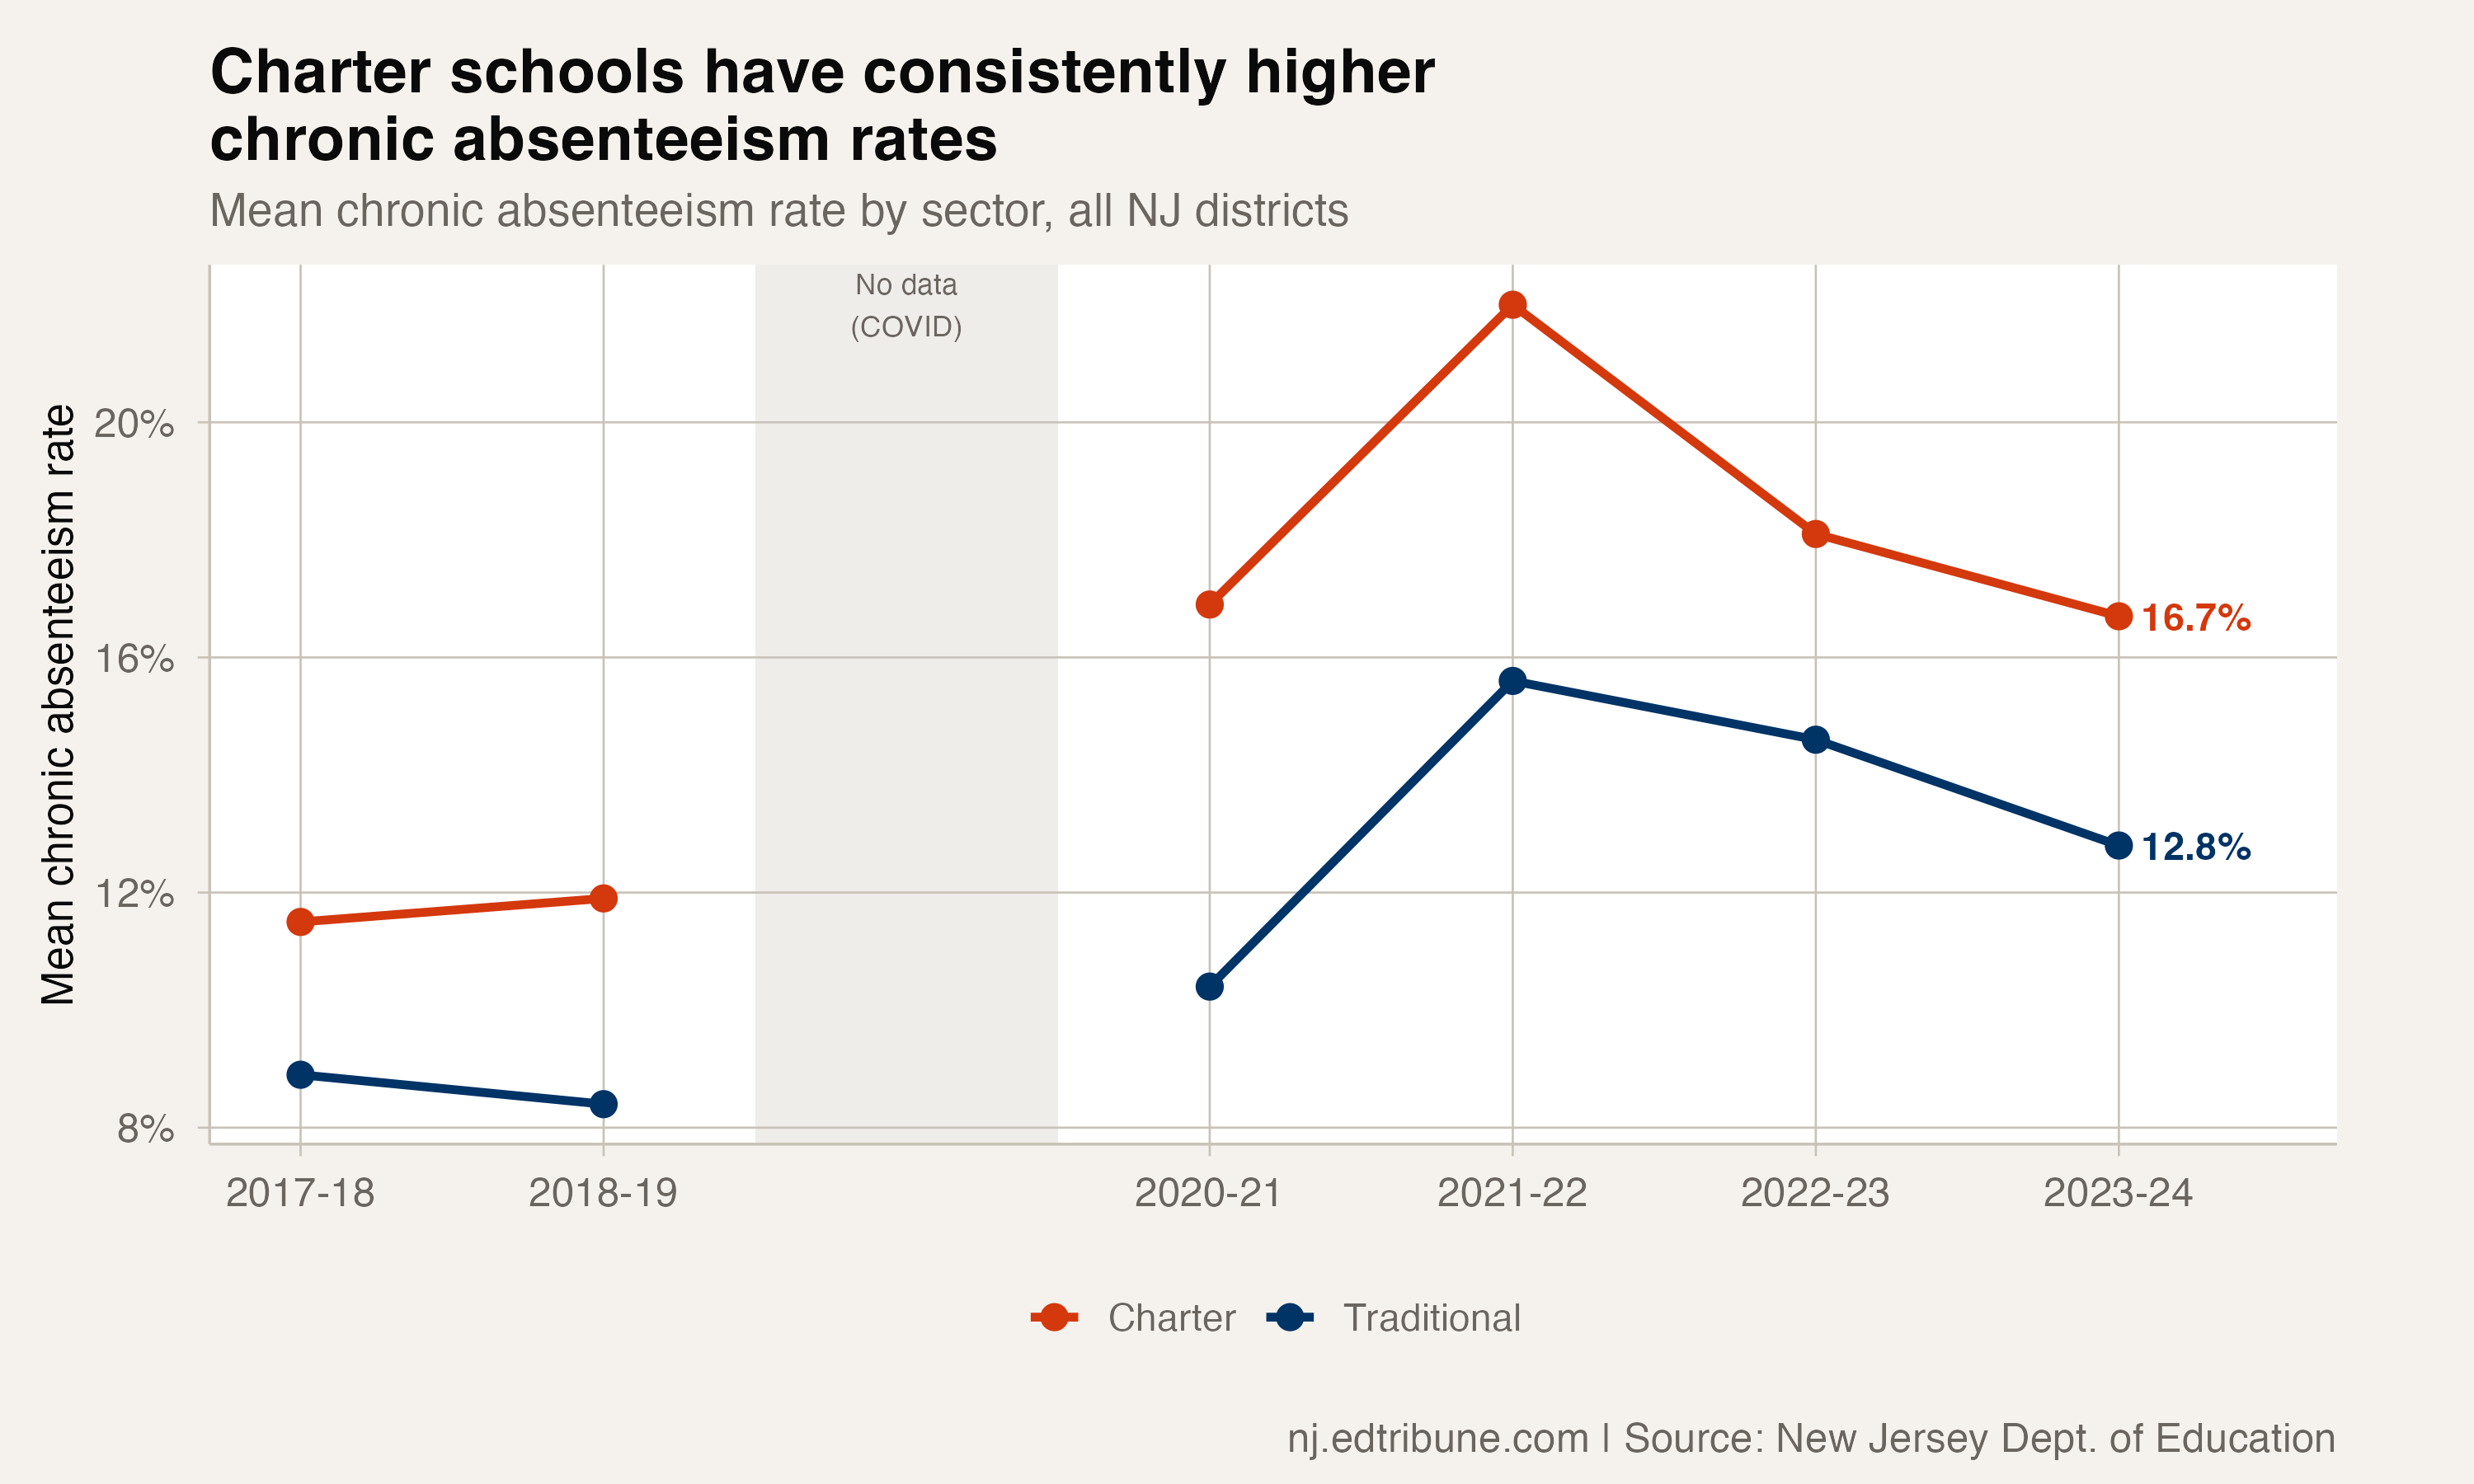
That average, 16.7% for the state's 85 charter districts in 2023-24, is 3.9 percentage points higher than the 12.8% mean for 564 traditional districts. It is a real gap. It has persisted for years. And it obscures almost as much as it reveals.
The headline number
Charter districts in New Jersey have posted higher mean chronic absenteeism rates than traditional districts in every year the state has reported the data. Before COVID, the gap was 3.5 percentage points: charter districts averaged 11.9% in 2018-19 compared to 8.4% for traditional districts.
The pandemic blew it open. By 2021-22, charter districts averaged 22.0% compared to 15.6% for traditional districts, a 6.4 percentage point spread. Two years of recovery have narrowed it, but not to where it was. The 2023-24 gap of 3.9 points is wider than the pre-COVID baseline.
Seven of the 20 highest chronic absenteeism rates in the state belong to charter districts, despite charters making up just 13% of all districts. LEAD Charter School's 71.4% rate is the highest in New Jersey by more than 20 points. Eight charter districts top 30%.
What the mean does not say
Switch from the mean to the median and the picture shifts. The median charter rate in 2023-24 was 14.6%, compared to 11.5% for traditional districts, a gap of 3.1 points instead of 3.9. Before COVID, the median gap was even narrower: 1.3 percentage points in 2018-19.
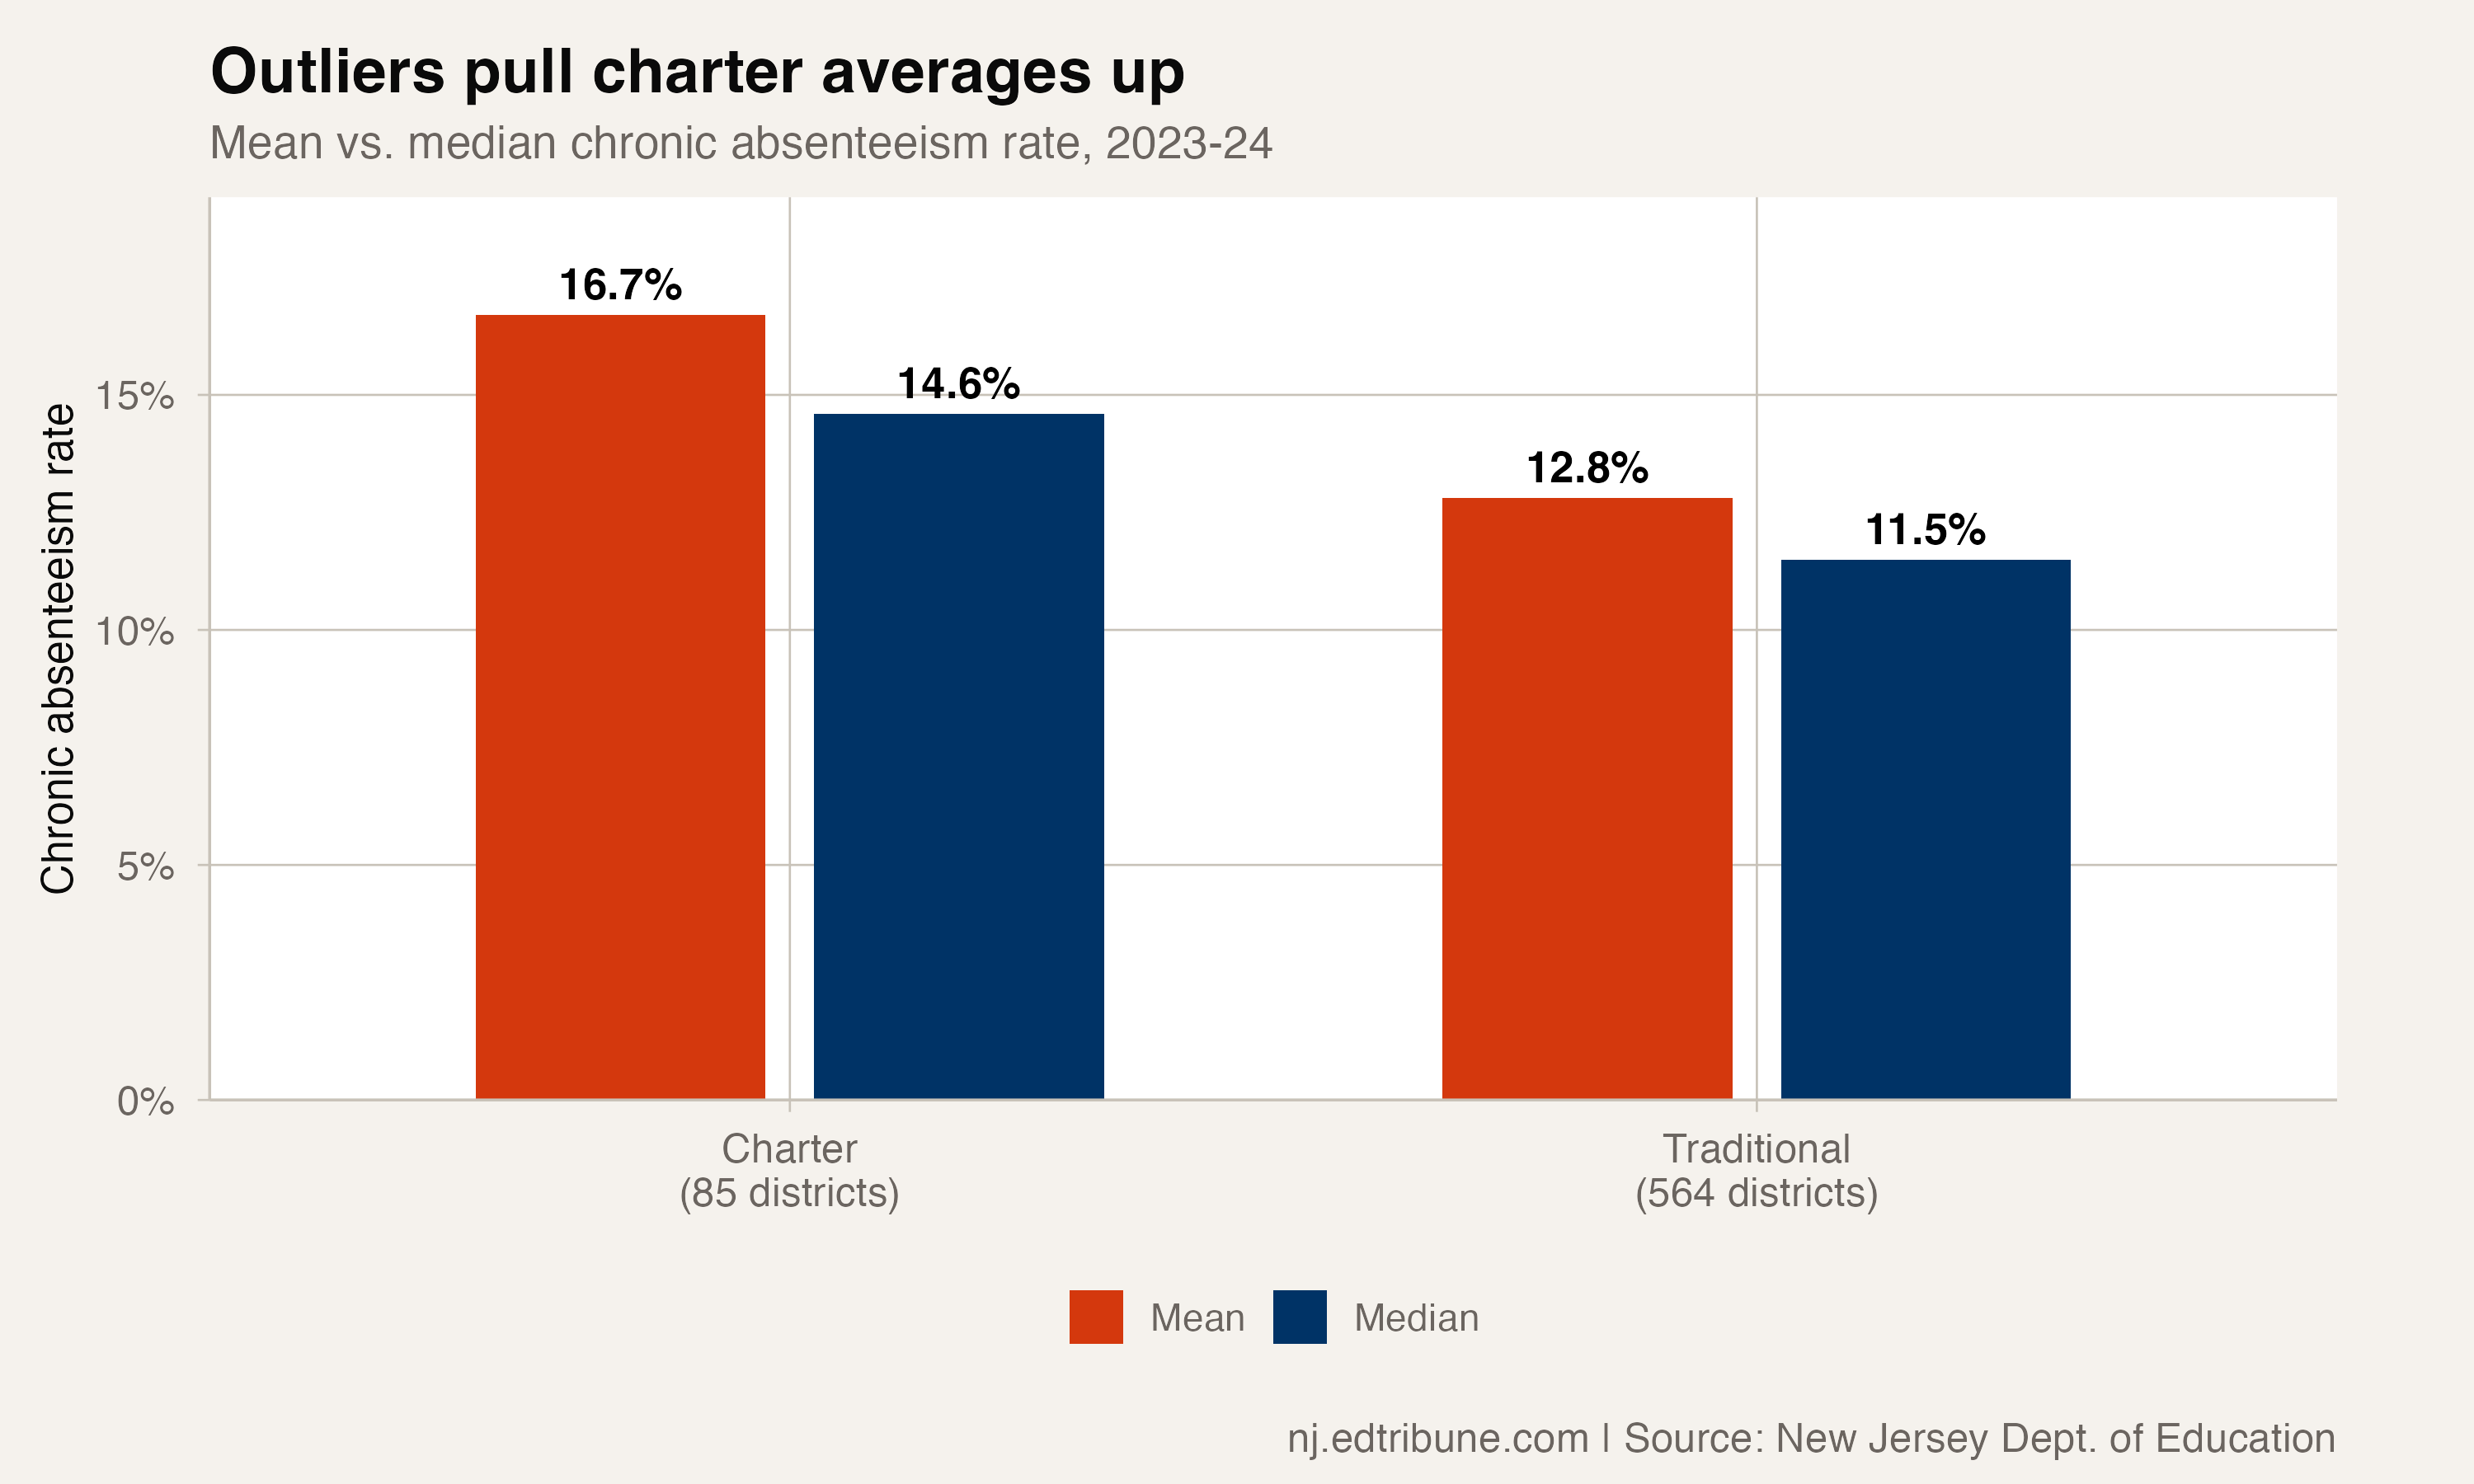
The difference between mean and median tells a specific statistical story: a small number of charter districts with very high rates are pulling the average upward. Remove the eight charter districts above 30% chronic absenteeism and the charter sector mean drops to 14.4%, barely above the statewide average of 14.9%.
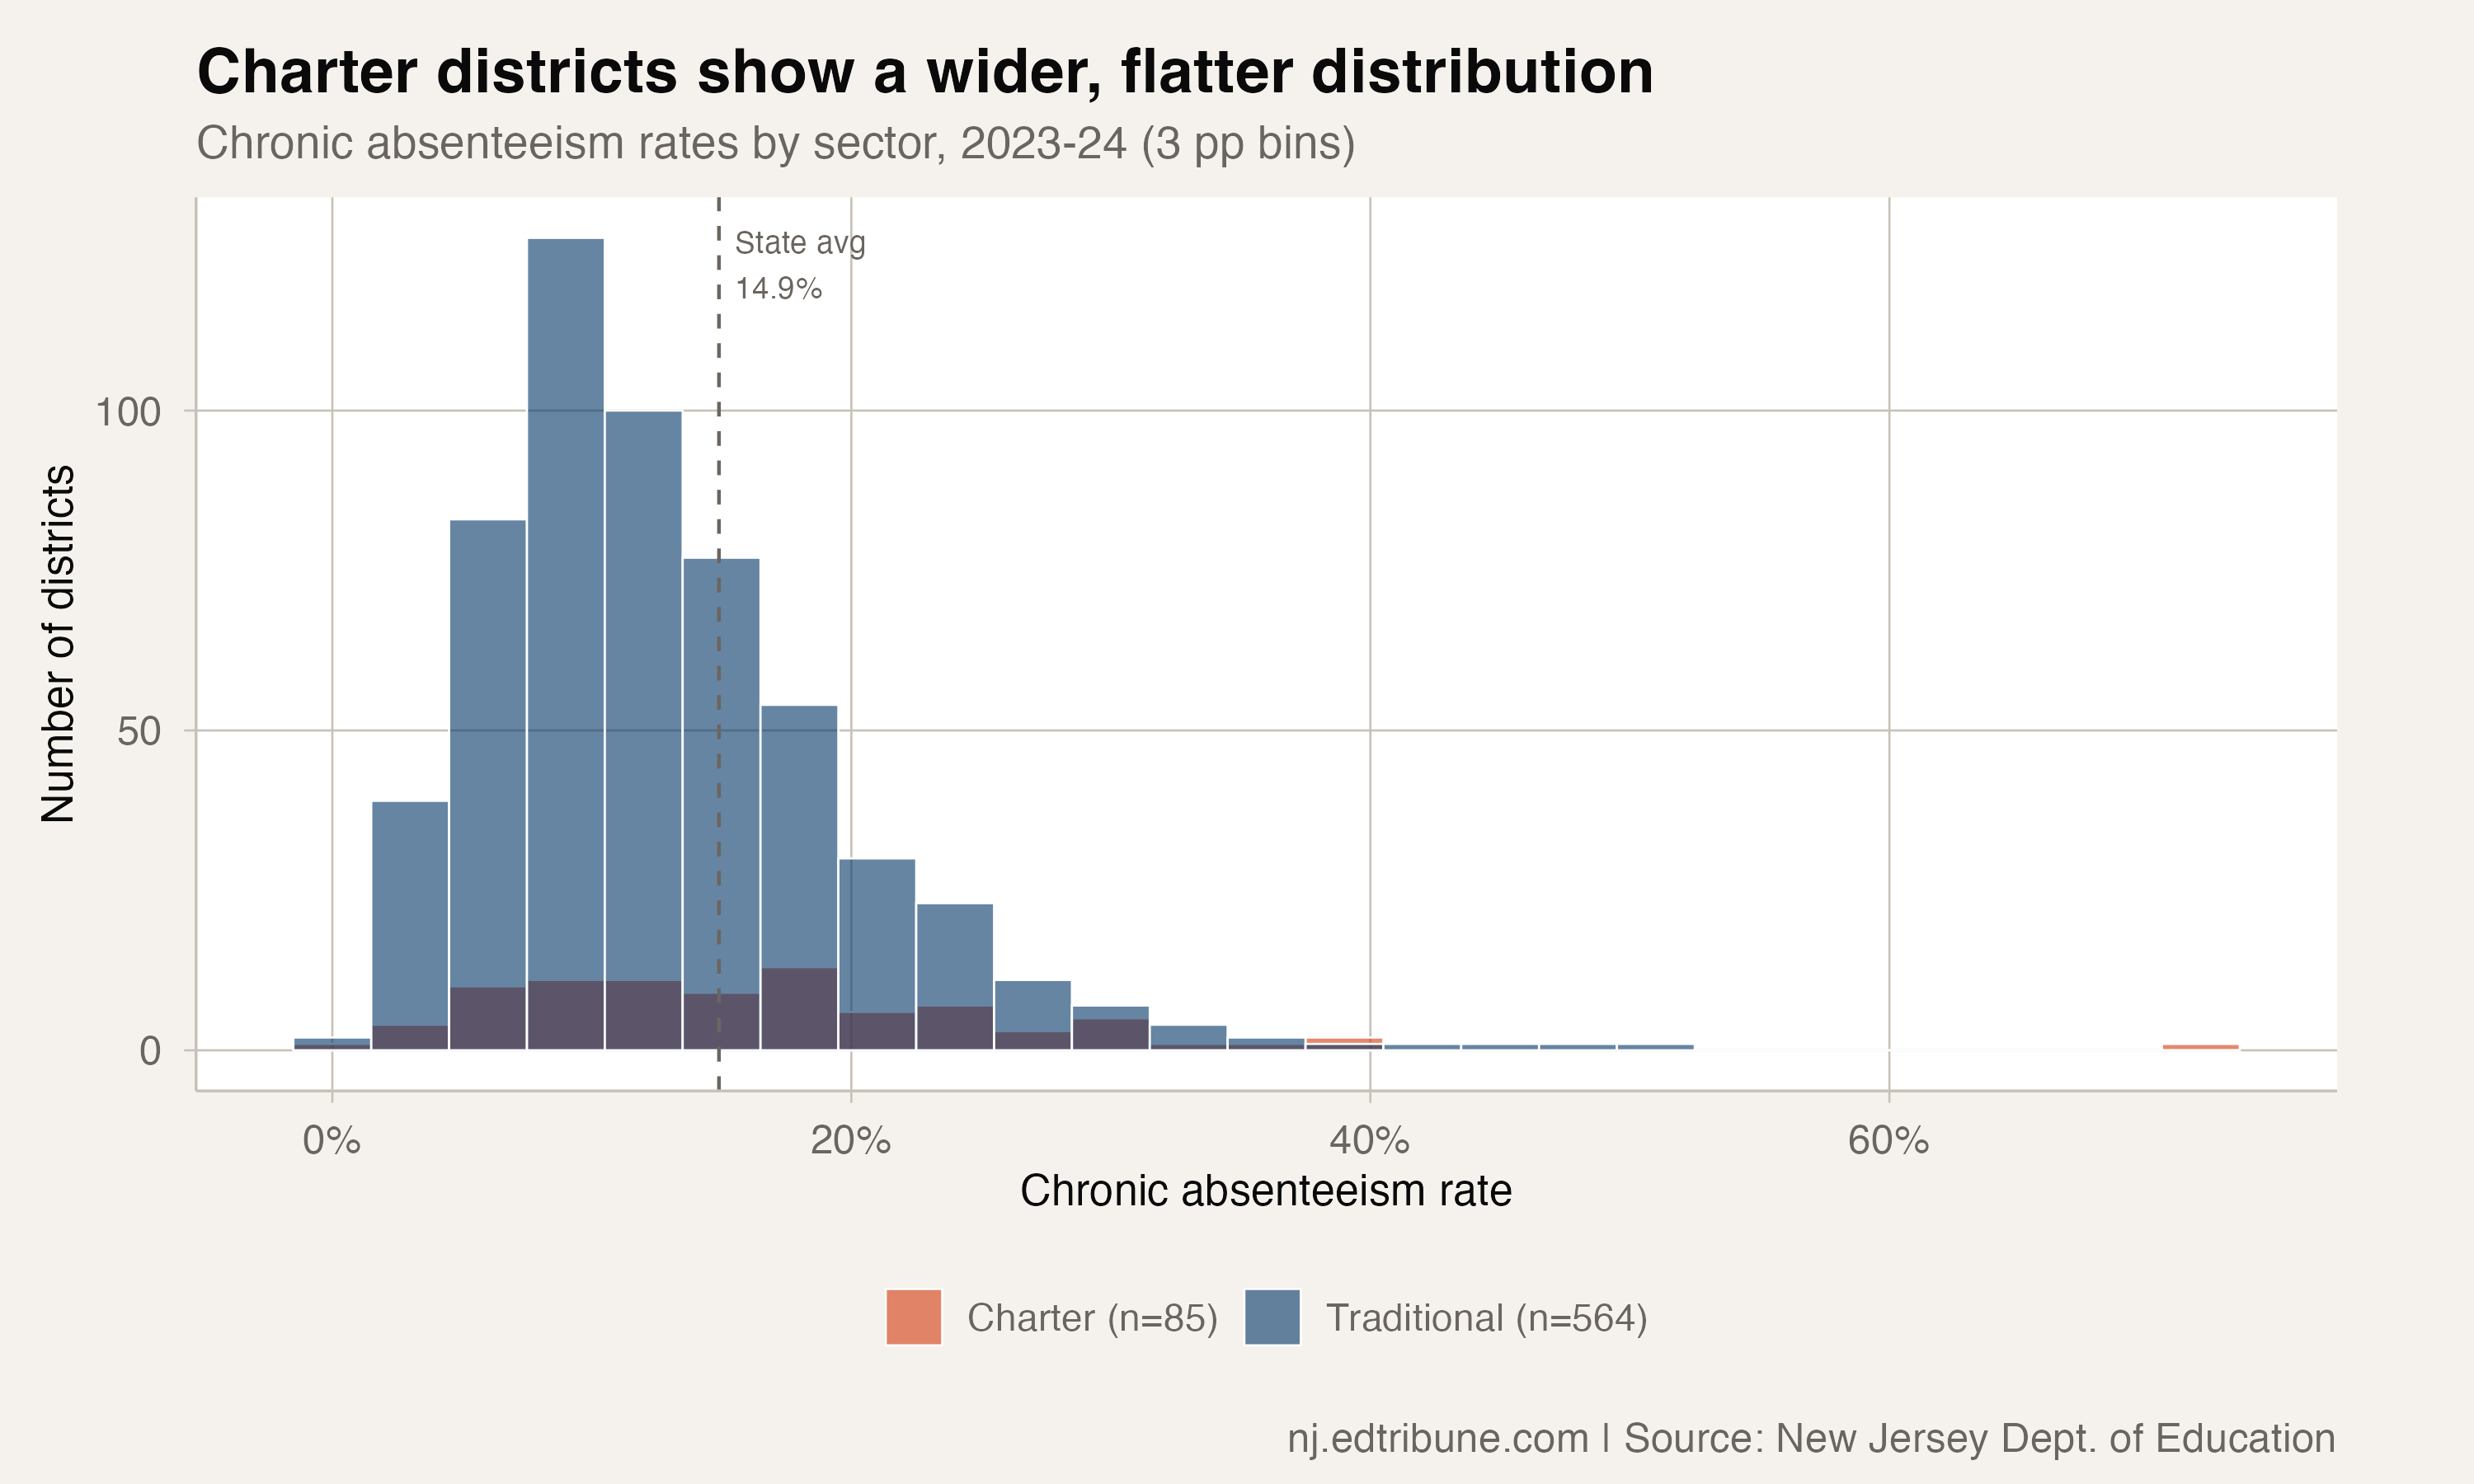
That matters because 43 of 85 charter districts, just over half, posted chronic rates below the state average in 2023-24. The charter sector is not uniformly worse. It is more variable. The interquartile range for charter districts runs from 9.9% to 21.7%, nearly 12 points wide. For traditional districts, it spans 8.0% to 16.2%, about 8 points. The charter distribution is flatter, with longer tails in both directions.
The best and the worst
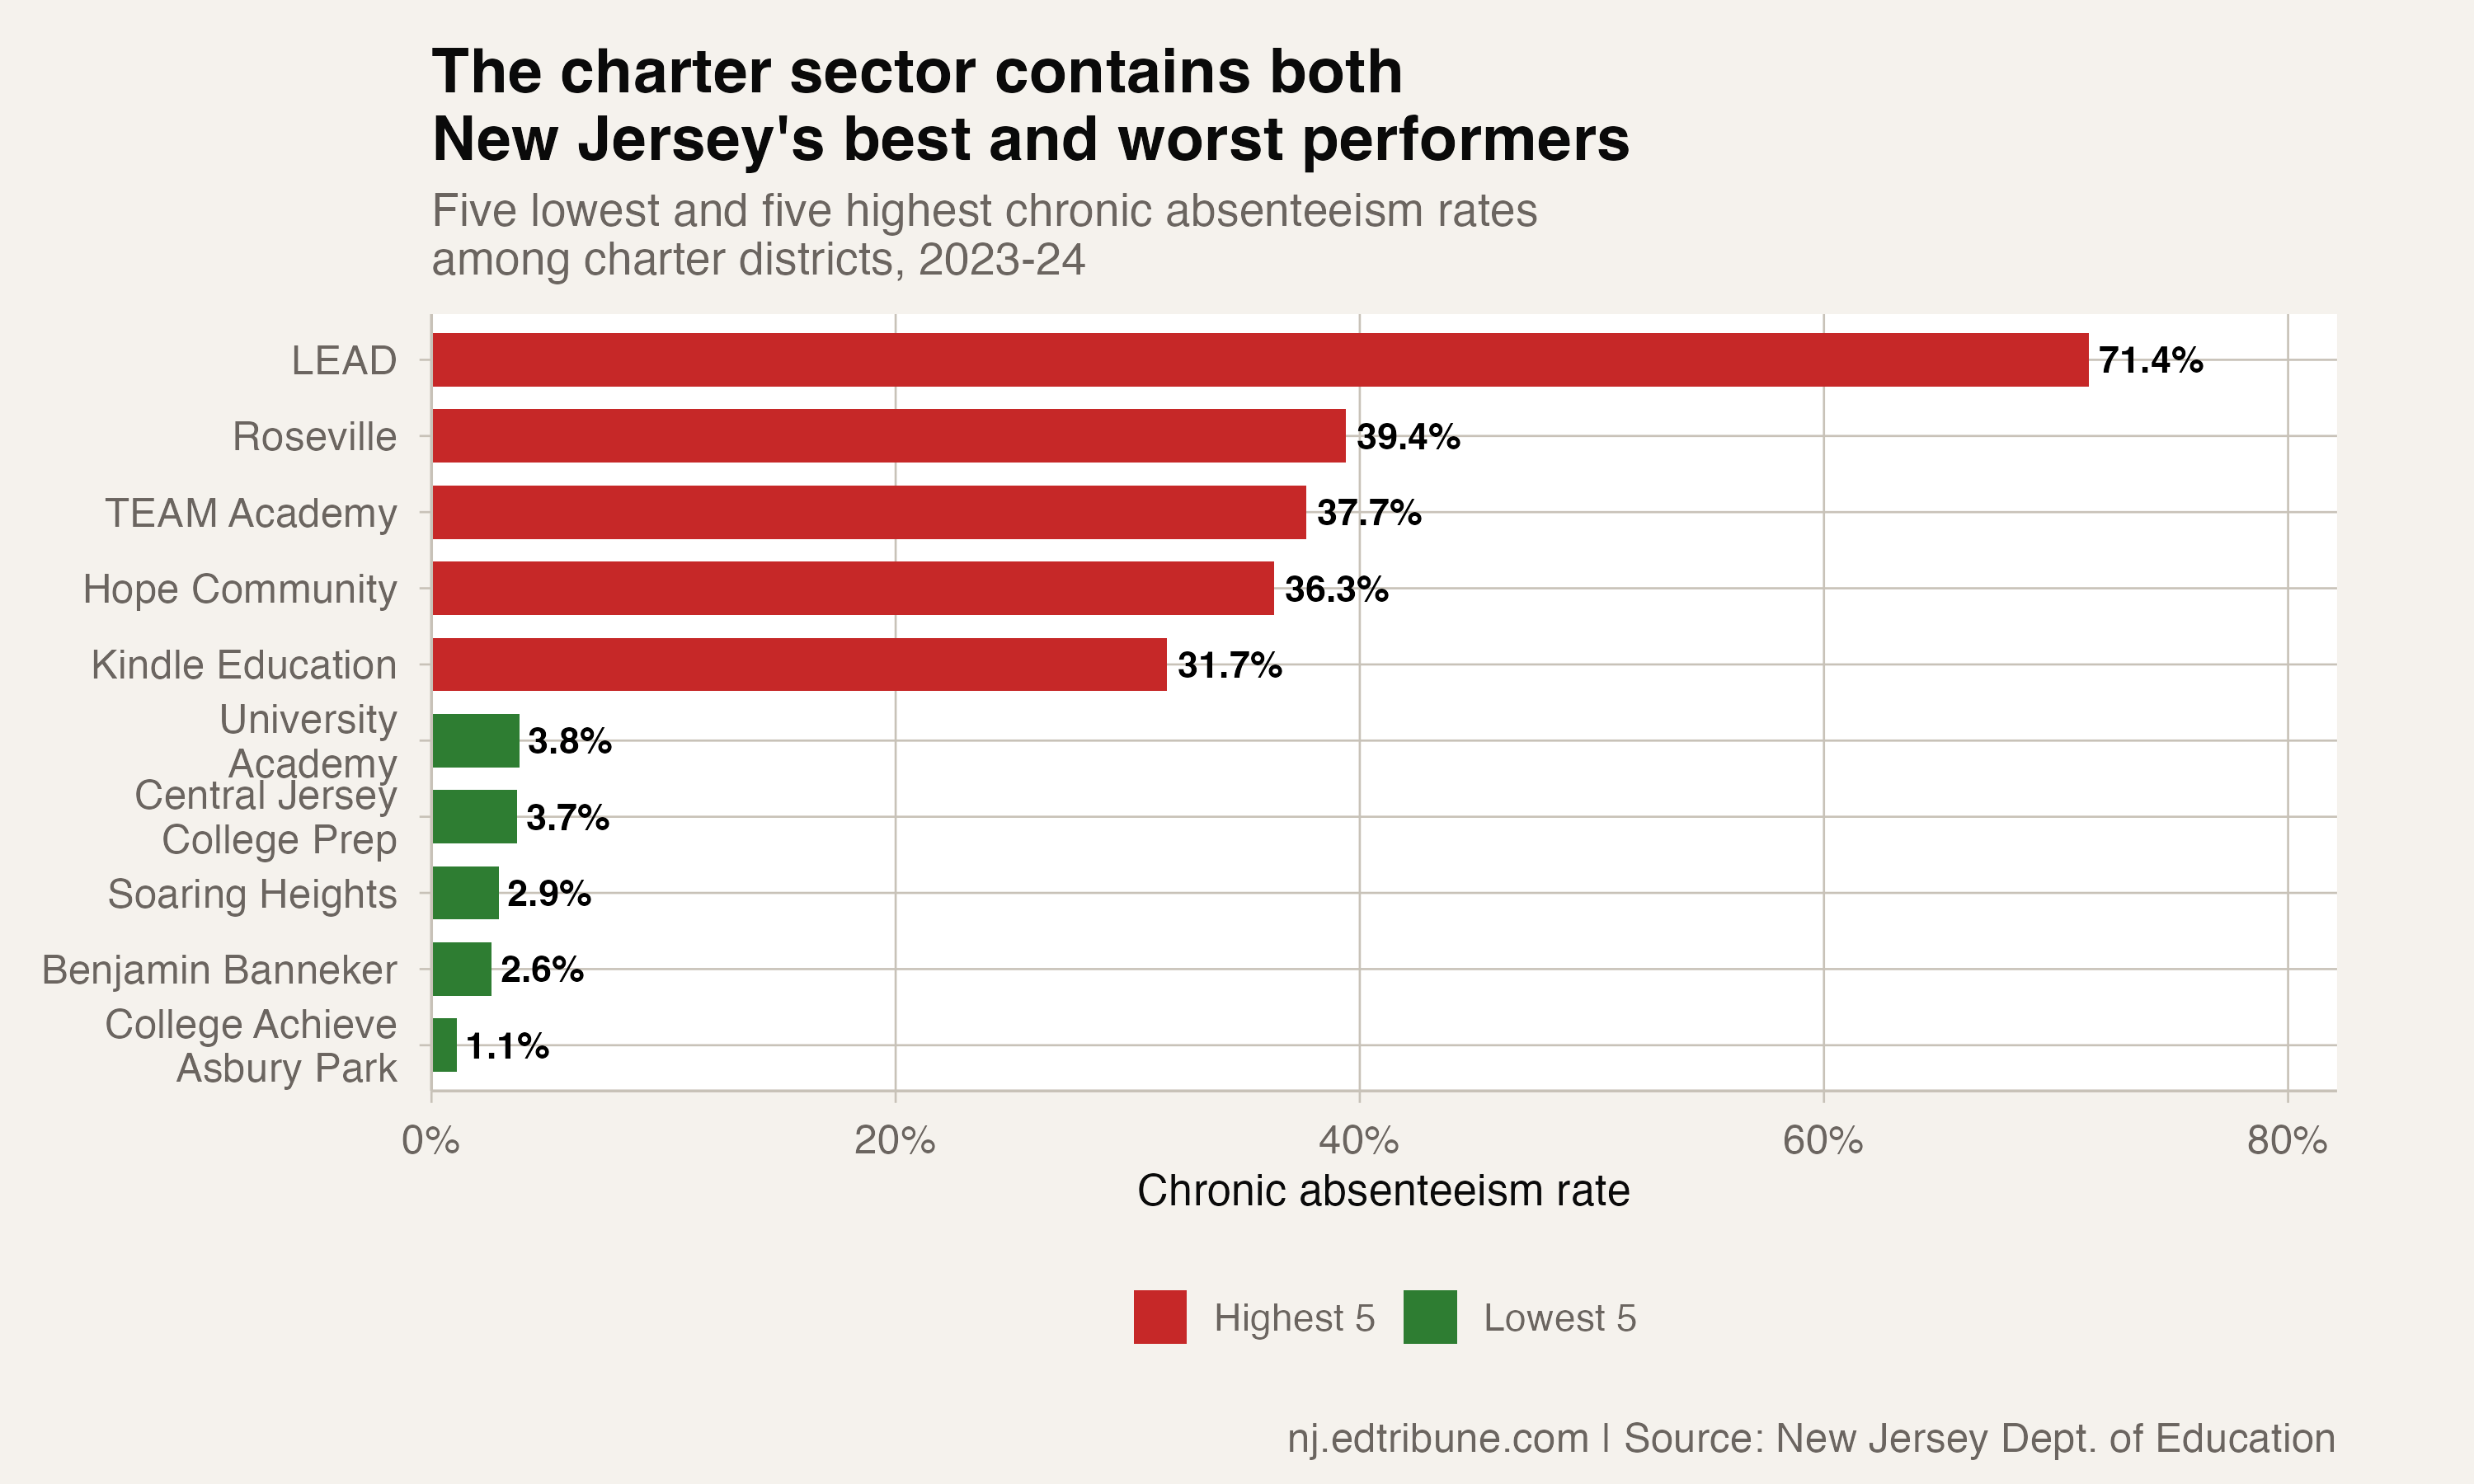
The five lowest chronic absenteeism rates among charter districts in 2023-24 would rank among the best performers in the entire state regardless of sector. College Achieve Greater Asbury Park (1.1%), Benjamin Banneker Preparatory (2.6%), Soaring Heights (2.9%), Central Jersey College Prep (3.7%), and University Academy (3.8%) all posted rates below 4%, figures that most affluent suburban districts do not reach.
At the other extreme, LEAD Charter School's 71.4% rate means nearly three in four students missed 10% or more of school days. Roseville Community (39.4%), TEAM Academy (37.7%), Hope Community (36.3%), and Kindle Education (31.7%) round out the high end.
The spread between the best and worst charter district, 70.3 percentage points, dwarfs the traditional sector's range. That single fact makes sector-level comparisons inherently slippery.
Why the comparison is not apples to apples
New Jersey's charter schools are concentrated in urban communities. According to the New Jersey Charter Schools Association, charter students are 44% Black, 41% Latino, and 76% economically disadvantaged. Charters disproportionately serve the student populations that face the highest chronic absenteeism rates statewide: Black students averaged 21.4% in 2023-24, economically disadvantaged students 21.2%, compared to 11.4% for white students.
A comparison between the average charter district and the average traditional district is, in part, a comparison between urban and suburban, between high-poverty and low-poverty, between the demographics that struggle most with attendance and the demographics that struggle least. The gap does not disappear when you account for this, but it shrinks.
The subgroup data underscores the point. Among charter districts reporting Black student rates, the mean was 19.8%. Among traditional districts, it was 15.9%. The charter premium narrows to 3.9 points within the same racial subgroup, roughly the same as the overall gap, suggesting that demographics explain some but not all of the difference.
The gap that widened
What COVID did to the charter-traditional divide is harder to explain away with demographics alone.
Before the pandemic, the median charter rate (8.7%) was within shouting distance of the median traditional rate (7.4%). By 2020-21, the first year back, the median charter rate had nearly doubled to 14.3% while the traditional median barely moved, from 7.4% to 7.3%. The median gap exploded from 1.3 points to 7.0 points in a single year.
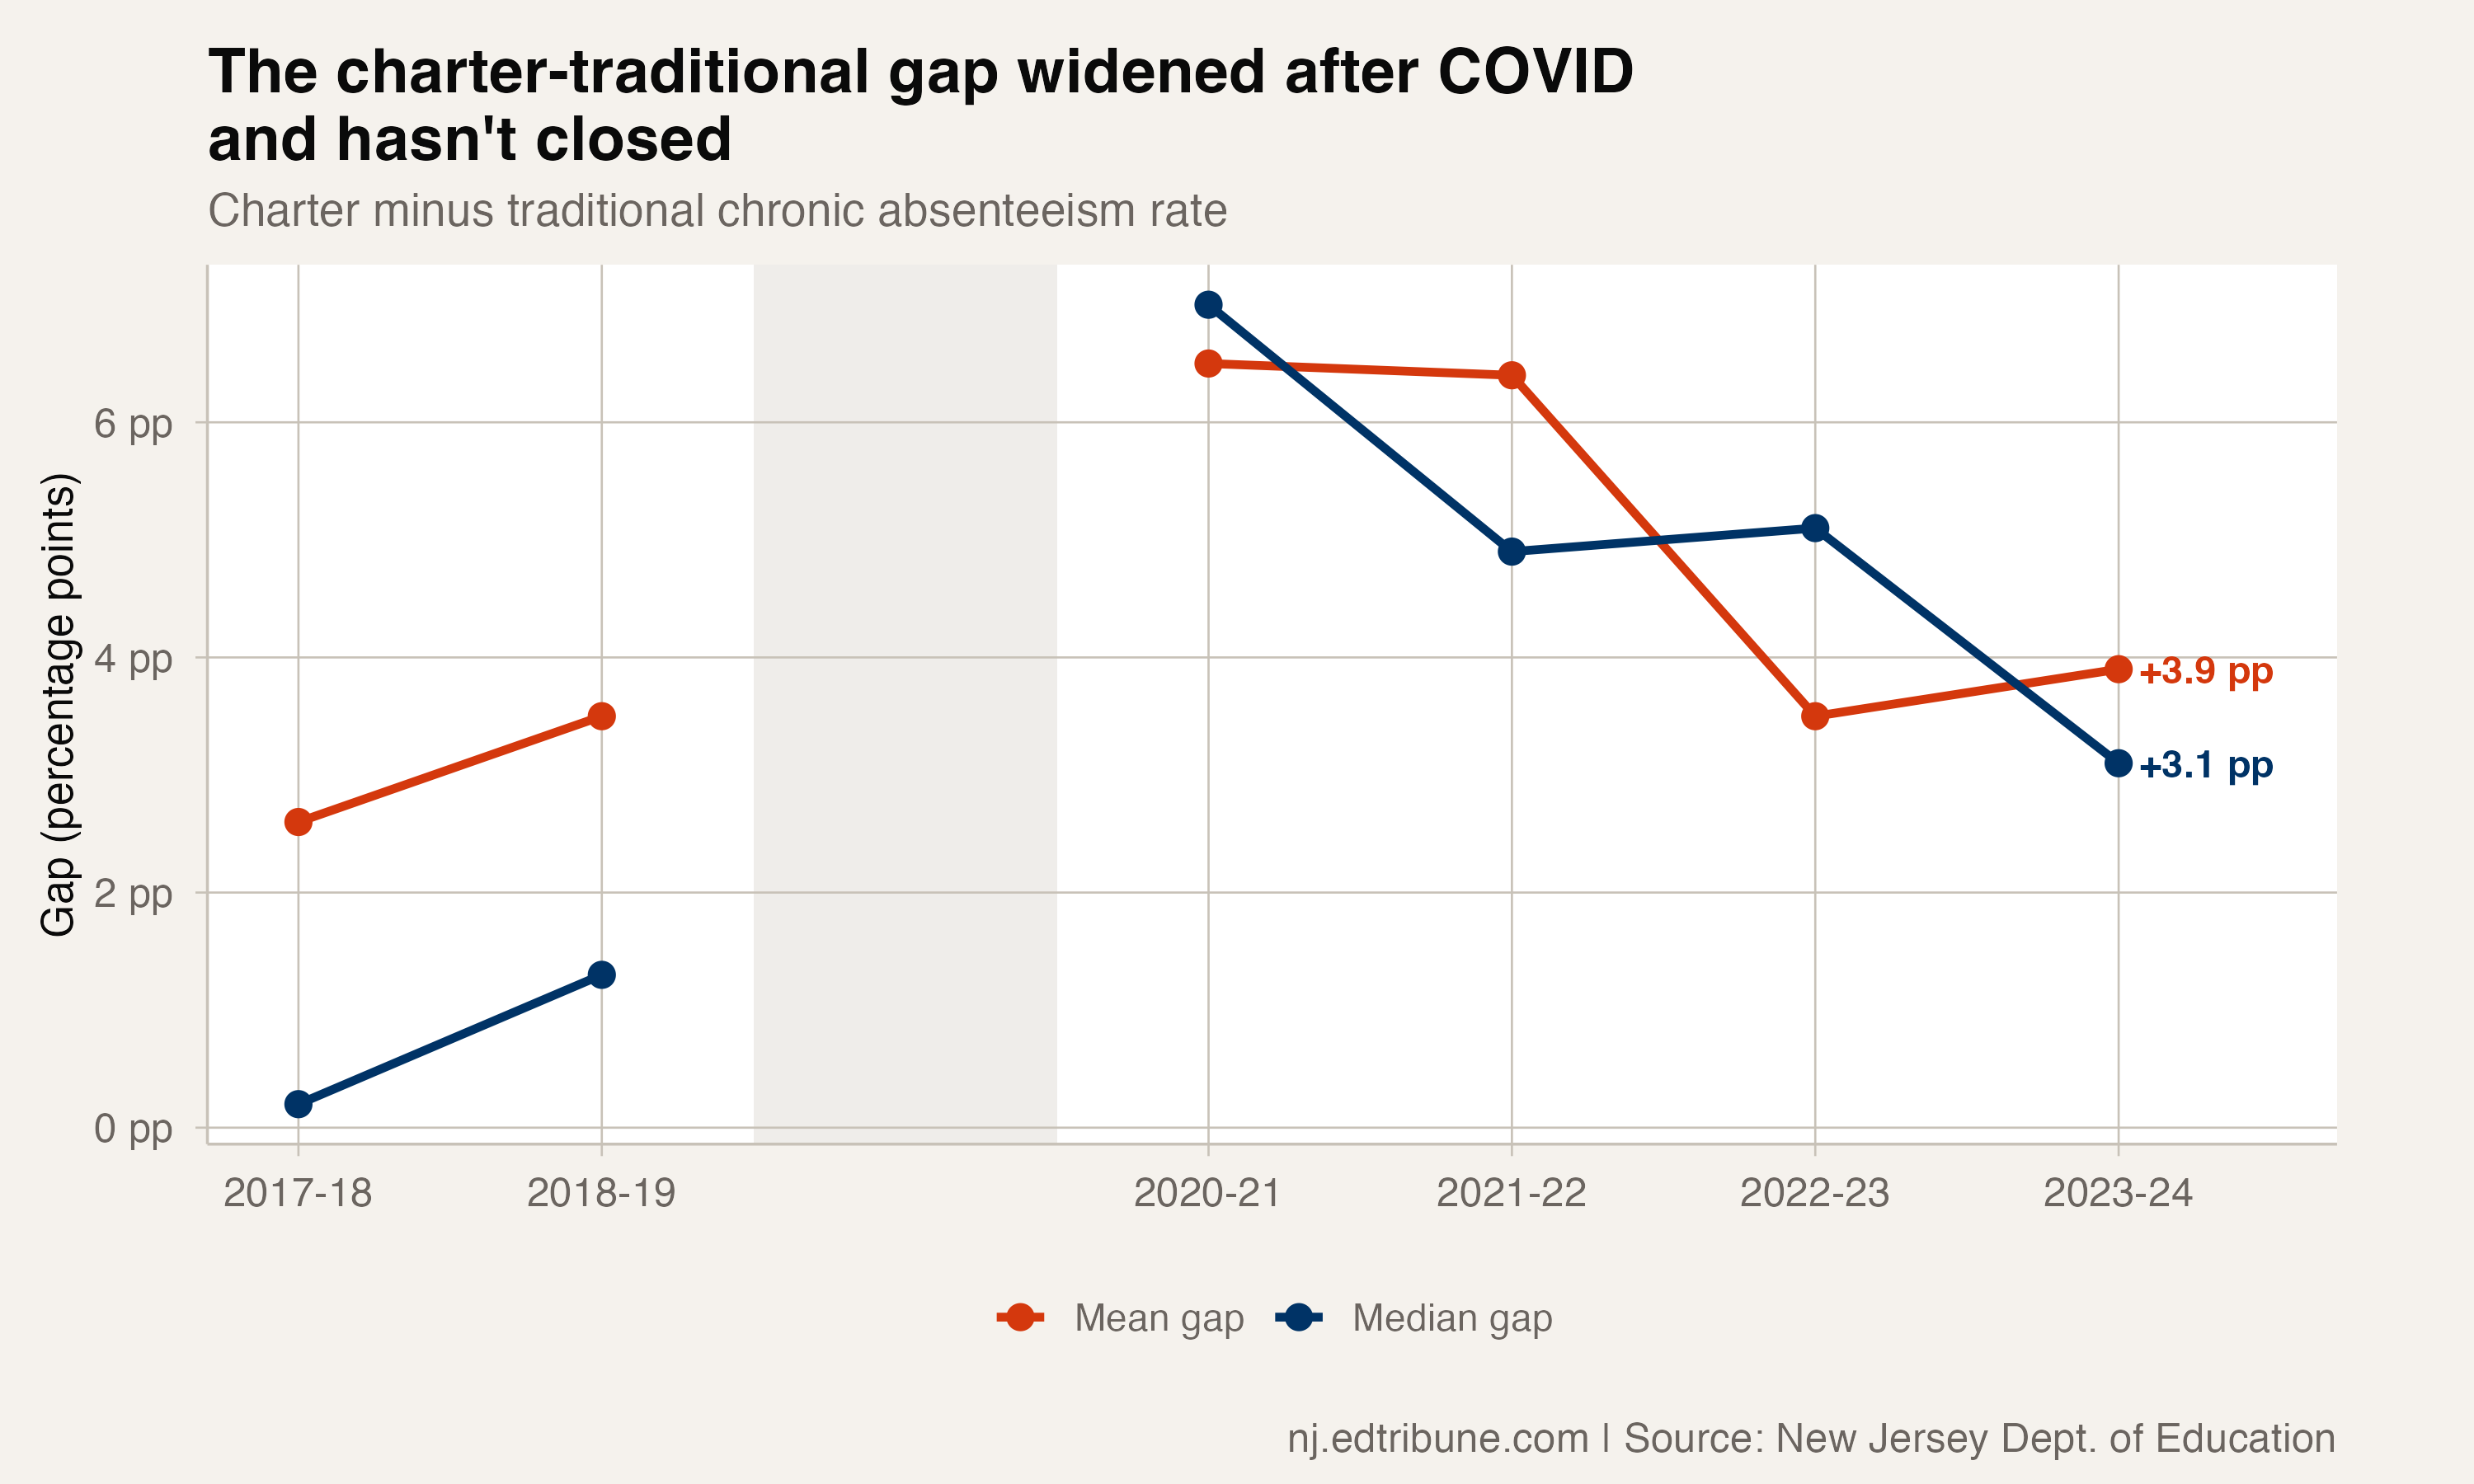
It has closed since then but not fully. The 2023-24 median gap of 3.1 points is still more than twice its pre-COVID level. Something about the pandemic hit charter attendance harder, and the recovery has been slower to take hold for the typical charter school.
One possibility: many charter schools lack the transportation infrastructure of traditional districts. New Jersey requires districts to bus K-8 students living more than two miles away, but charter schools often draw students from across district lines with no guaranteed transportation. Families who relied on public transit or carpools during pre-COVID years may have found the return-to-school logistics harder to sustain.
What accountability looks like
New Jersey requires any school with chronic absenteeism above 10% to develop an Attendance Review Team and corrective action plan. Charter schools are subject to the same requirement. In 2023-24, 63 of 85 charter districts (74.1%) exceeded that threshold, compared to 332 of 564 traditional districts (58.9%).
Charter schools face an additional layer of accountability that traditional districts do not: their charters can be revoked. A charter school with persistently poor performance risks non-renewal by the state Commissioner of Education. Whether chronic absenteeism alone has ever triggered a non-renewal is unclear from available public records, but it factors into the School Performance Reports that inform renewal decisions.
The number that matters most
The most useful number in this analysis may not be the gap between sectors. It may be 43, the number of charter districts that beat the state average. Or 8, the number above 30% that drag the sector mean upward. Or 1.1%, the rate at College Achieve Greater Asbury Park, a charter school serving economically disadvantaged students in a city where attendance is typically a struggle.
The charter sector is not a monolith. It contains schools operating in similar communities with similar demographics that produce wildly different attendance outcomes. That variation, more than the sector-level average, is where the actionable information lives. A charter school in Trenton posting 5.1% chronic absenteeism and a charter school in Newark posting 37.7% are both charters. The question worth asking is not which sector is better but what the best performers in both sectors are doing that the worst are not.
Detailed code that reproduces the analysis and figures in this article is available exclusively to EdTribune subscribers.
Discussion
Sign in to join the discussion.
Loading comments...