In this series: The NJEdTribune examines New Jersey's latest enrollment decline, the districts defying it, and the demographic shifts underneath the statewide total.
Jersey City↗ET Public Schools enrolled 27,464 students in the fall of 2009. In the fall 2025 file, the district enrolled 25,307. The 16-year loss, 2,157 students, is just under 8 percent. The slide is unusual mostly because of how undramatic each year of it has been.
Since the district's local peak of 27,810 in the 2014-15 school year, Jersey City has lost students in 10 of the 11 subsequent years. The annual drops have ranged from a few dozen to a few hundred, almost never crossing 500 students in a single year. There is no pandemic crater, no policy shock, no single fall that broke the line. Jersey City has slipped about one and a half percent per year, more or less, for more than a decade.
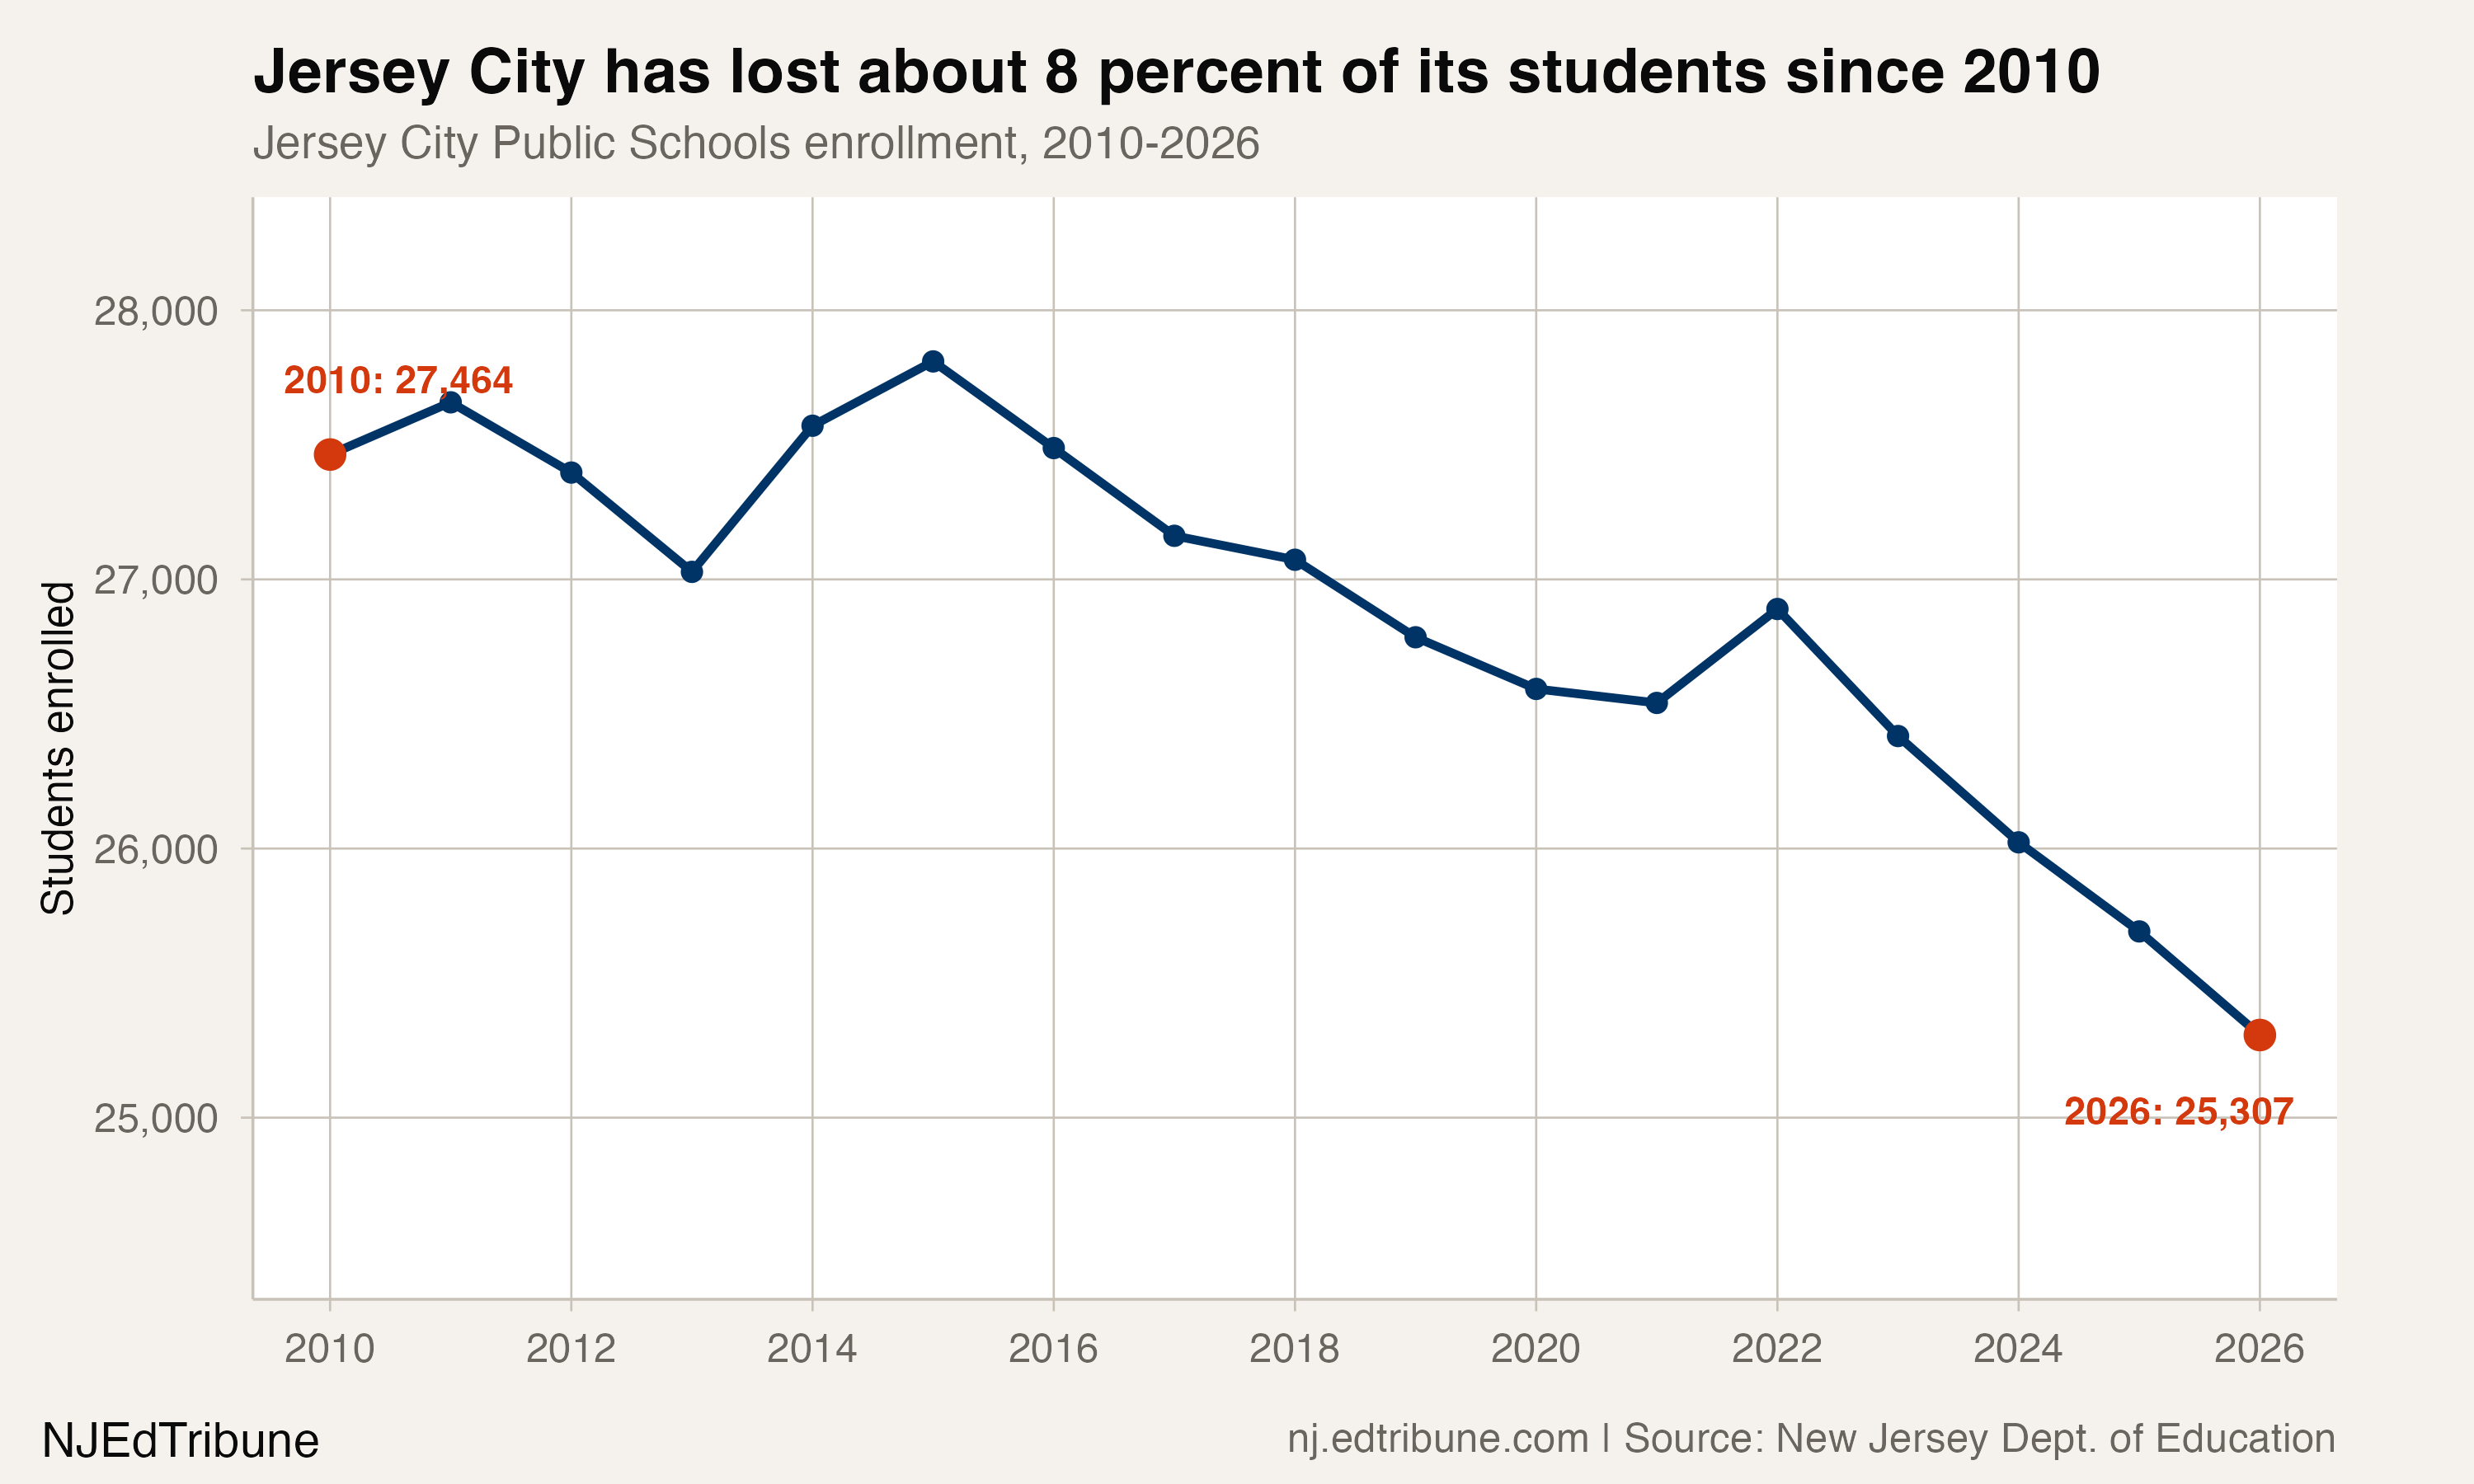
The slow shape of the contraction has hidden it from view. When Paterson↗ET lost 4,218 students in three years, the headlines came quickly. When Newark↗ET added 7,552 students in seven, the press releases followed. Jersey City has been moving in the same direction the whole time, but the speed of its movement has never made it the lead story.
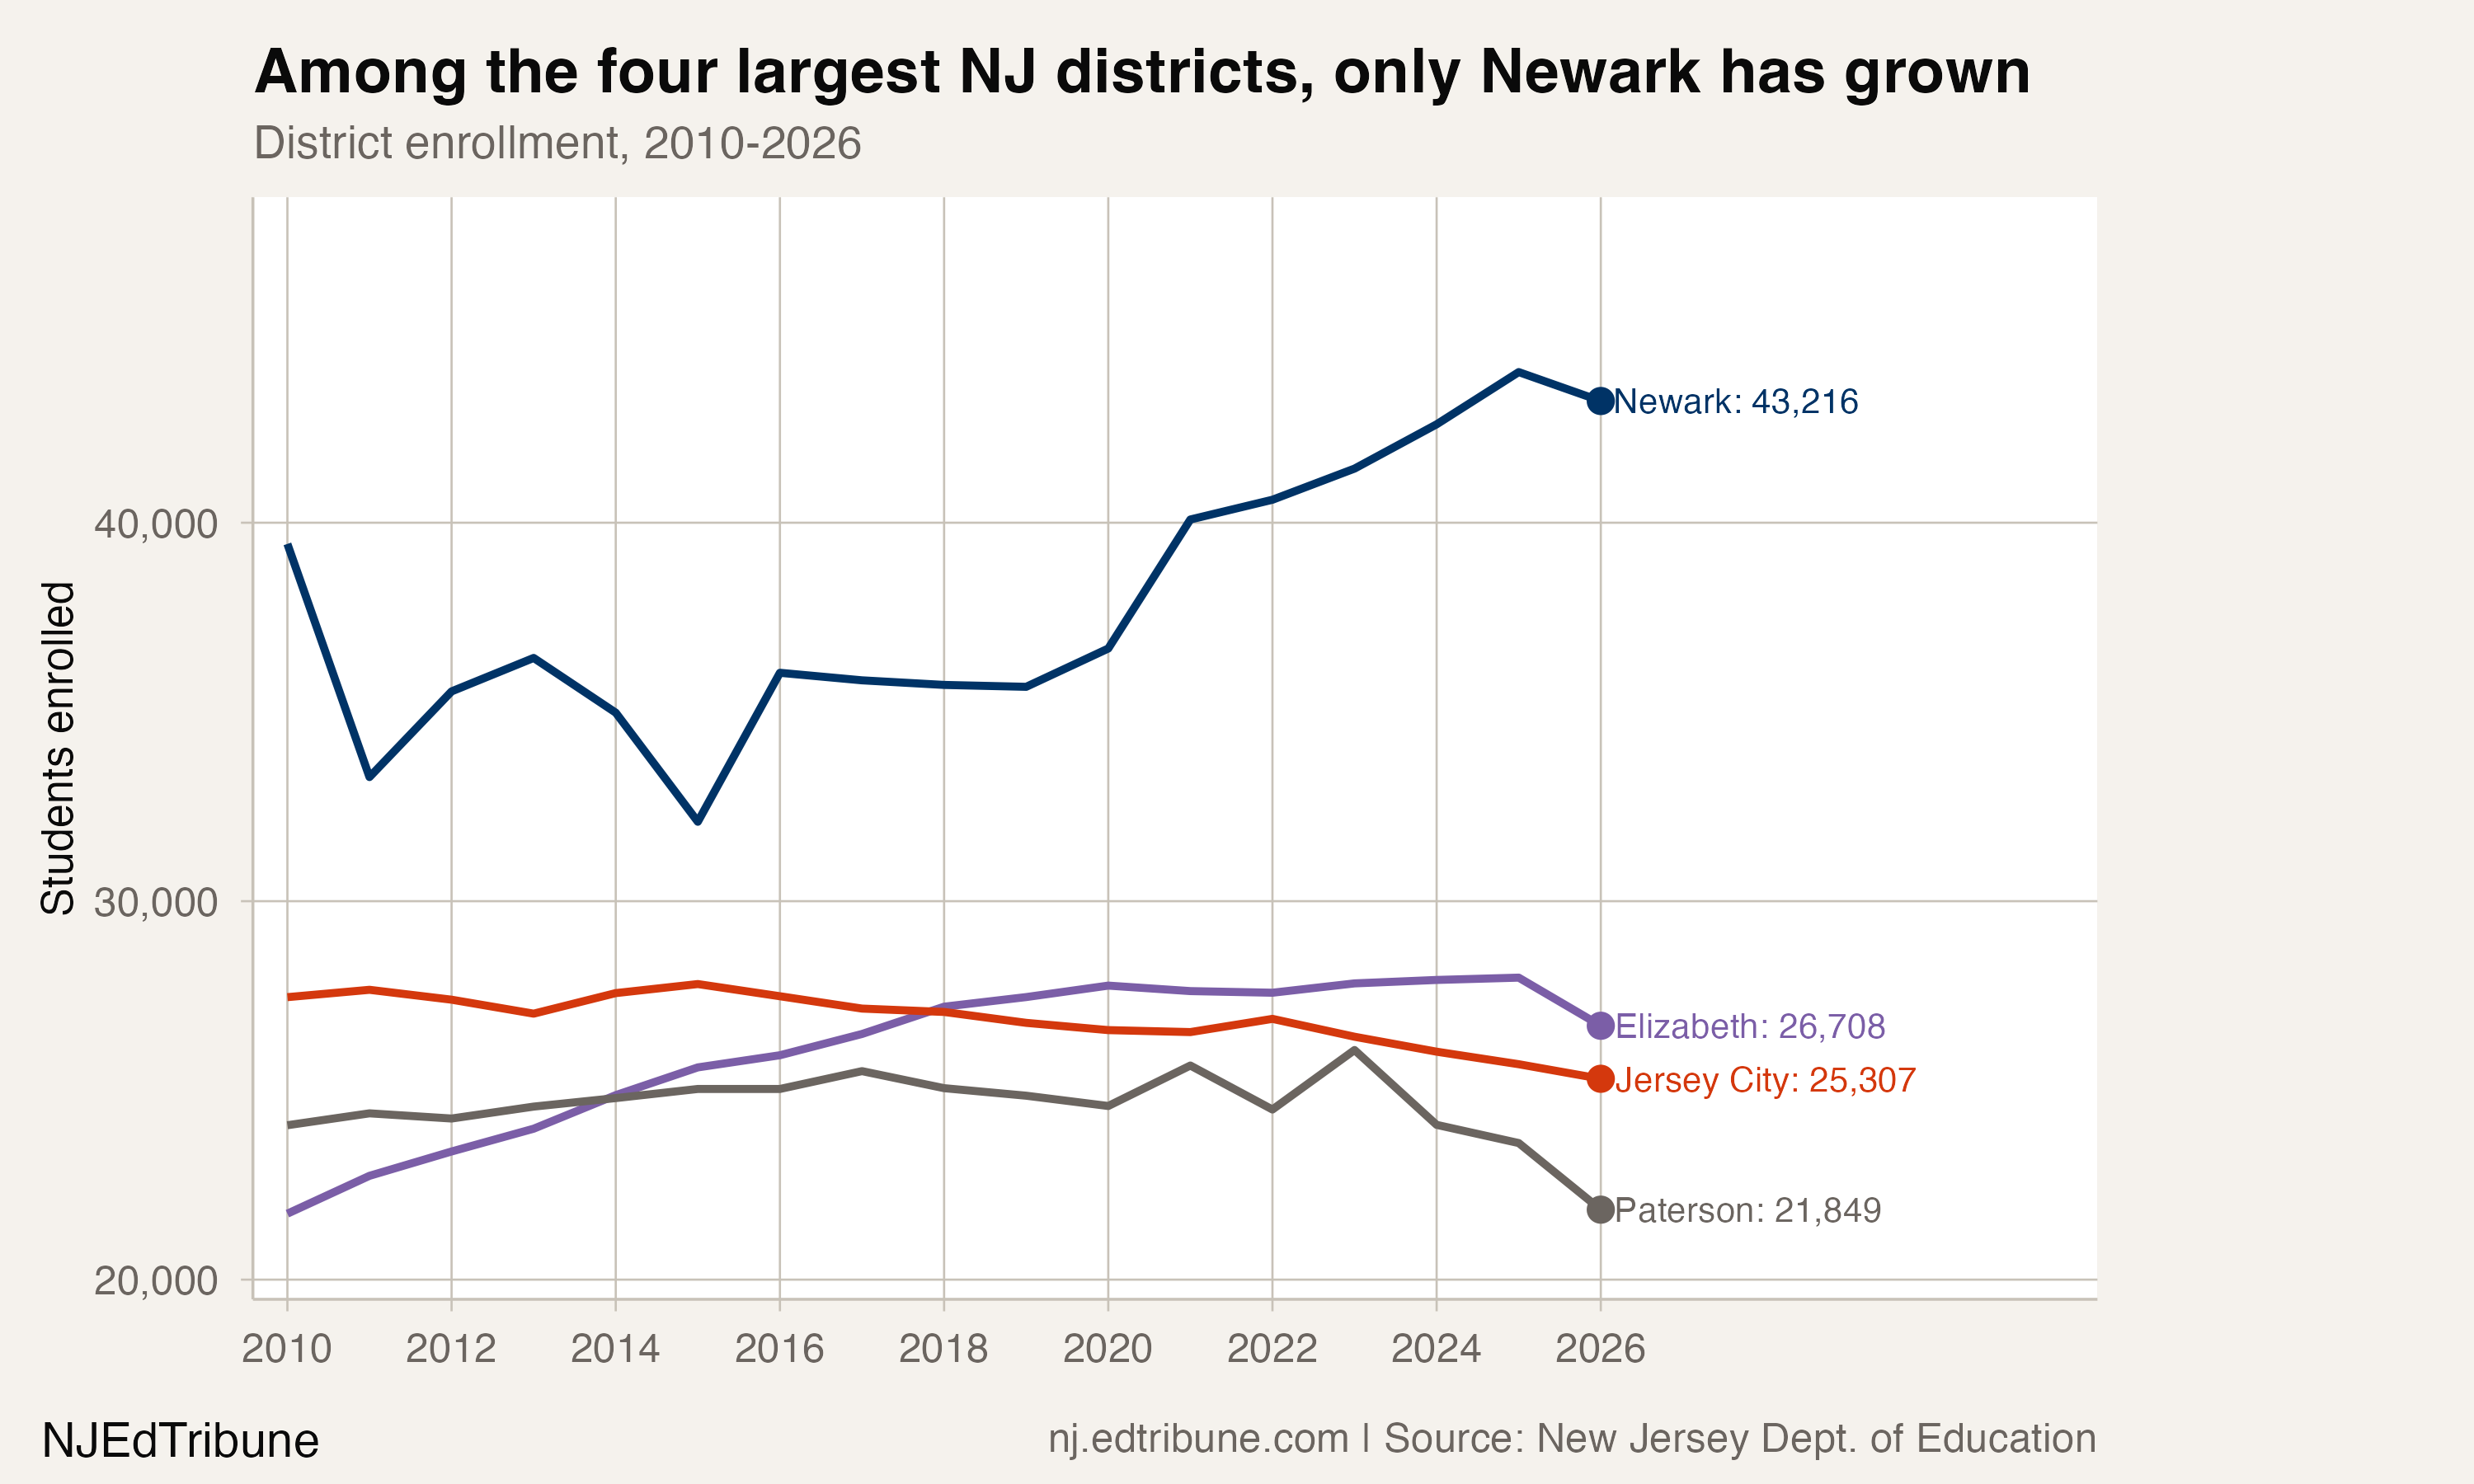
The cumulative effect is striking. In 2010, Jersey City was the second-largest district in New Jersey, behind only Newark. By 2019, Elizabeth↗ET had passed it, and Jersey City fell to third. In 2026, the gap to Elizabeth has widened to roughly 1,400 students, and Paterson, after its own steep recent decline, now trails Jersey City by 3,458. The order of the state's four largest districts (Newark, Elizabeth, Jersey City, Paterson) has been stable since 2019, but the spread between them keeps changing.
The Newark divergence
The single most useful comparison for Jersey City is the district eight miles to its west.
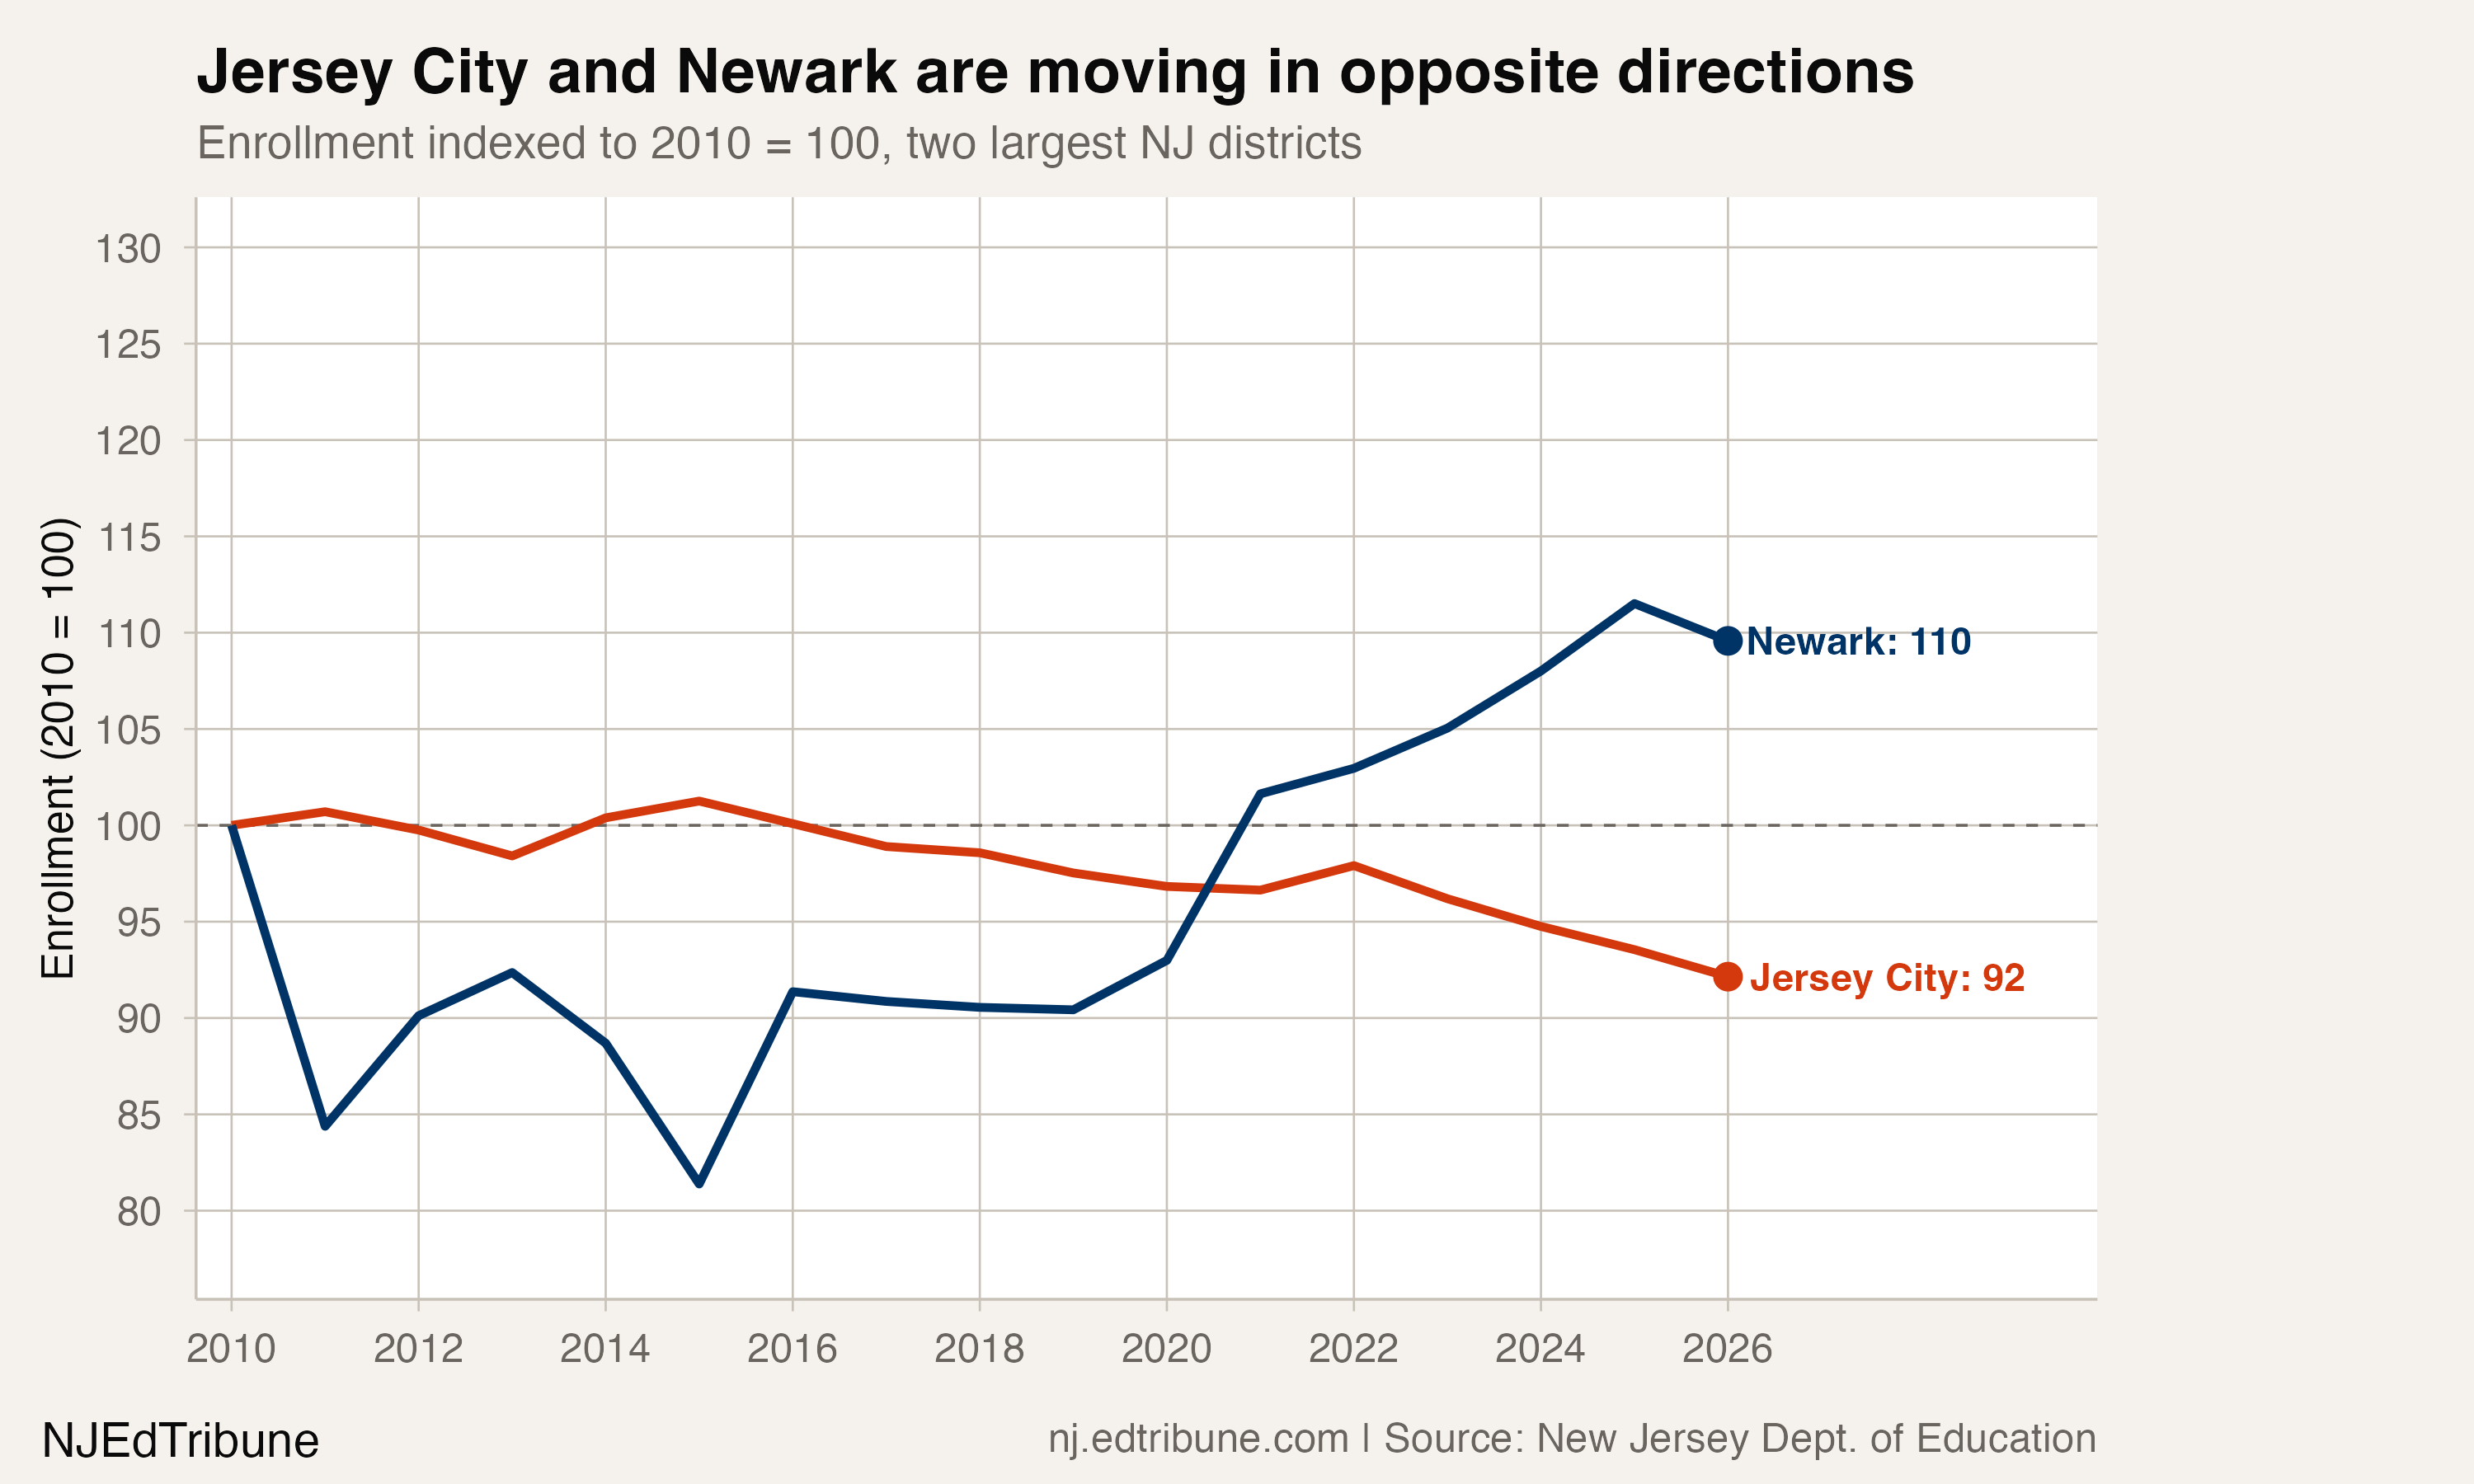
In 2010, Newark enrolled 39,440 students and Jersey City enrolled 27,464, a gap of 11,976. The gap narrowed to 4,288 students by 2015. Then the directions reversed. Newark began climbing in 2016 and accelerated sharply after 2019, while Jersey City continued its slow slide. In the fall 2025 file, the Newark-to-Jersey-City gap was 18,288, the widest in the panel, even though Newark posted its first single-year loss since 2019.
Over the full 16-year window, Newark added 3,776 students and Jersey City lost 2,157. Over the post-2019 window, the gap is sharper: Newark added 7,552 and Jersey City lost 1,478. The two largest districts in New Jersey, both heavily Hispanic, both with meaningful charter sectors, both serving low-income families in the urban core of the state, have produced enrollment trajectories that look like mirror images.
The conventional wisdom about urban districts in 2026 is that they are losing students to charters, to suburbs, to homeschooling, and to a falling birth rate. Newark's growth complicates that story in one direction. Jersey City's persistent erosion, sitting right next to Newark, complicates it in another.
What the housing market is doing
Housing costs provide useful context, although the enrollment file cannot test whether they caused the decline.
Apartment List's rental market report ranks Jersey City the seventh most expensive large city in the country, with a median rent close to the citywide New York figure.
Apartment List's Newark report calls Newark the metro area's most affordable city. That contrast is suggestive context only; the enrollment data do not identify where families moved or why.
The internal data on Jersey City tells the same story from another angle. The district's white enrollment grew from 2,980 in 2010 to 4,547 in 2026, a 53 percent increase, while overall enrollment fell. White students are now 18.0 percent of the district, up from 10.9 percent in 2010. Black enrollment fell over the same window, from 9,393 (34.2 percent) to 5,878 (23.2 percent), a loss of 3,515 students. Hispanic enrollment stayed roughly flat in absolute terms (10,445 to 9,470) and barely moved as a share (38.0 percent to 37.4 percent). Asian enrollment grew modestly from 4,184 to 4,650, but its share rose from 15.2 percent to 18.4 percent because the denominator shrank.
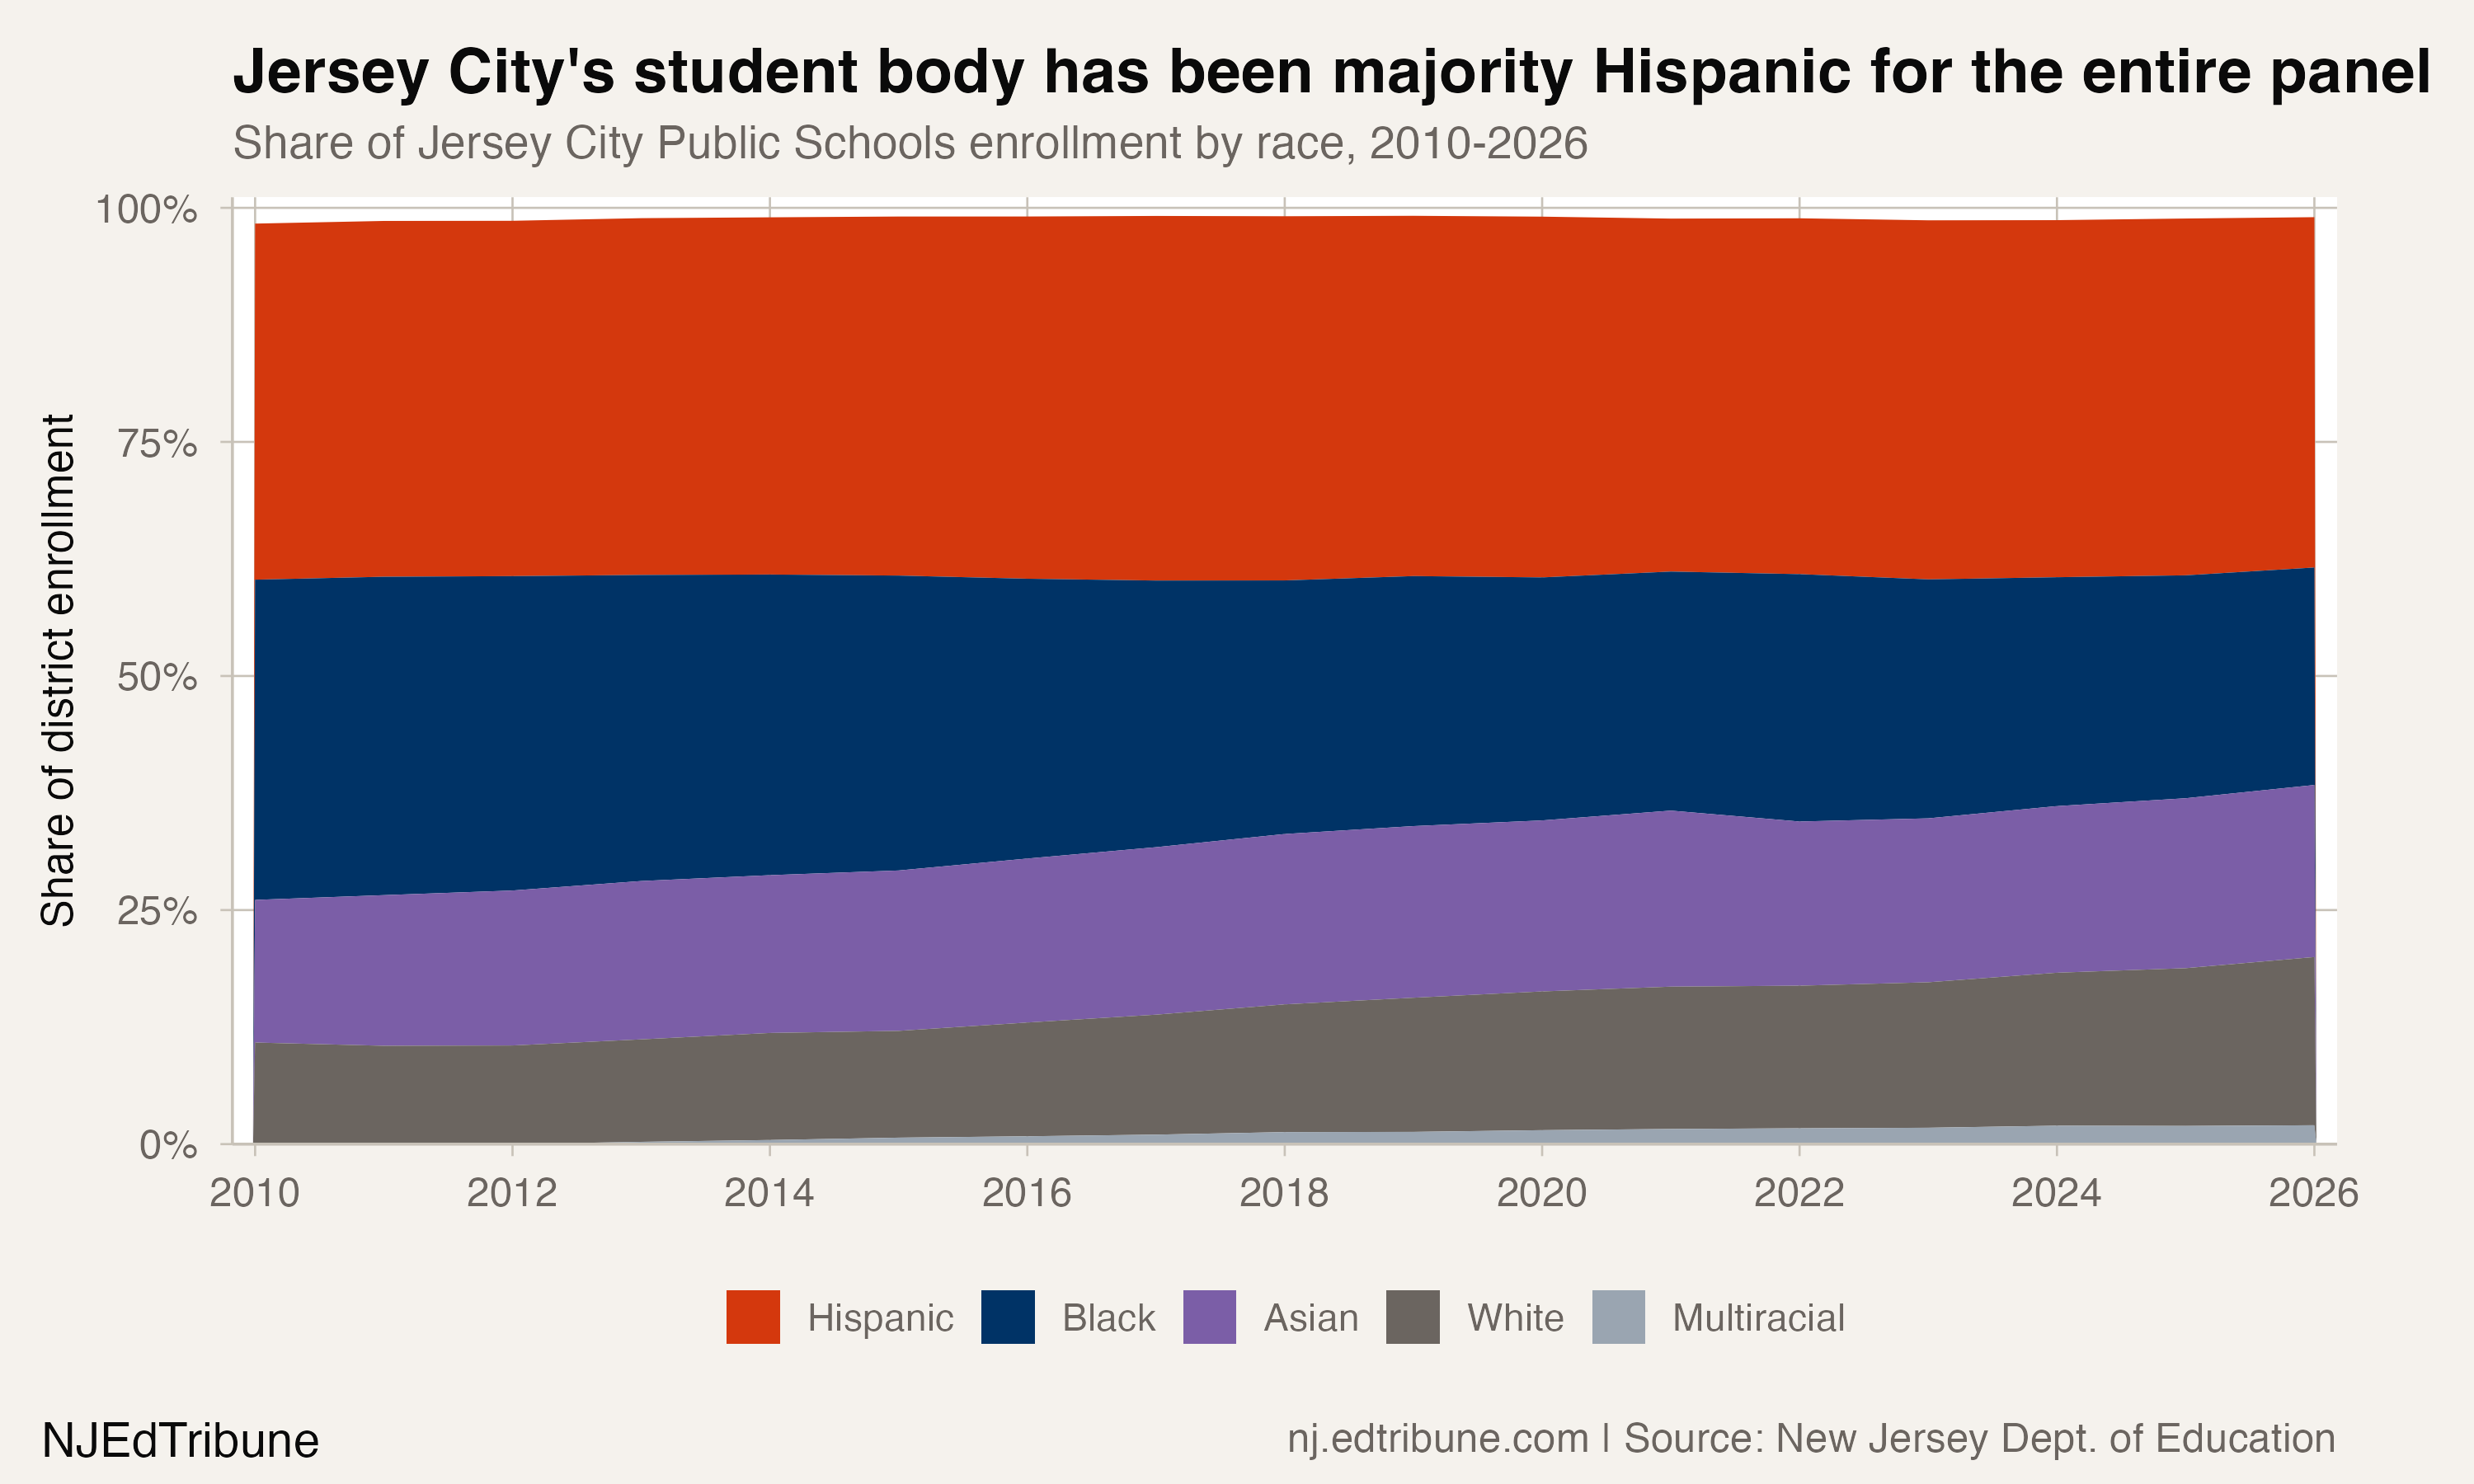
The changing racial composition is consistent with several possible explanations, including family displacement, charter enrollment, and demographic change. The enrollment file does not distinguish among them.
The district's superintendent, Dr. Norma Fernandez, pointed to three pressures acting at once. "The decline in the U.S. birth rate, combined with stricter immigration policies and ongoing gentrification, has significantly impacted Jersey City," Fernandez wrote in a response to The NJEdTribune. The state's file counts who is enrolled each fall. It does not record births, new arrivals, or which families moved away and why, so it cannot weigh those three forces against one another. Her account comes from the district that has watched them play out.
The charter half of the picture
The other half of the picture is the charter sector inside Jersey City's boundaries.
Eight charters serving Jersey City students enroll about 5,934 children in the 2026 file. In 2016, the first year all eight appear in the state file, the same group enrolled about 3,715. The sector has grown by about 60 percent in the decade since. The largest, Beloved Community Charter, grew from 355 students in 2013 to 1,571 in the 2026 file. Empowerment Academy grew from 190 in 2016 to 1,368. The other six, Jersey City Golden Door, Jersey City Community, University Academy, Jersey City Global, the Ethical Community Charter School, and the Learning Community Charter School, each enroll between about 340 and 670 students.
If those roughly 5,934 charter students were enrolled in the district, Jersey City would enroll about 31,000 students. They are not, and the district's published enrollment is 25,307.
Newark also has a large charter sector, including North Star Academy and KIPP Newark. The enrollment file shows that charters are part of both cities' school landscapes; it does not by itself explain the districts' different trajectories.
What is happening inside the schools
Even with overall enrollment falling, the shape of Jersey City's classrooms has changed substantially.
Pre-K enrollment in the district is up 42 percent since 2010, from 2,714 to 3,844. The K-through-5 grades, by contrast, are down 11 percent over the same window, from 12,039 to 10,740. Middle school enrollment (grades 6 through 8) is down 10 percent. High school enrollment is down 10 percent.
The English-language learner population has grown substantially even as overall enrollment has fallen. Jersey City identified 2,178 students as Limited English Proficient in 2010, or 7.9 percent of the district. In 2026, the figure is 3,973, or 15.7 percent. The share has roughly doubled, and the absolute count has grown by 1,795 in a district that has lost 2,157 students overall. The implications are operational: a district that is shrinking on the total line but adding ELL infrastructure has a tighter staffing problem than the headline number suggests.
What Newark has that Jersey City does not
The contrast with Newark is what makes the Jersey City line so interesting, because the two districts share so many of the things that are supposed to drive enrollment loss in urban America.
Both have substantial Hispanic enrollment (Newark 62 percent, Jersey City 37 percent) and charter sectors. Those similarities make the different district-enrollment trends worth comparing, but they do not establish a cause.
Zumper's rent report lists Newark's median rent below Jersey City's.
In the state enrollment file, Newark's Pre-K count increased by more than 4,600 students from 2019 to 2026. The two facts are context, not evidence that one caused the other.
The result, after seven years of divergence, is that the 2026 file shows Newark enrolling 17,909 more students than Jersey City. In 2015, that gap was 4,288. The reordering of New Jersey's two largest school districts has happened almost entirely in the past decade.
What to watch next
The most important question for Jersey City is whether the slide stabilizes or accelerates. The 2026 file shows a single-year loss of 385 students, in line with the district's recent pattern of annual losses of a few hundred students, but it lands in a year when New Jersey lost 23,732 students overall, the largest single-year drop on record in the 17-year panel. A holding-pattern year for Jersey City inside a falling state is not the same kind of news as a holding-pattern year inside a stable one.
The Pre-K line is the most concrete leading indicator. Jersey City's Pre-K enrollment, 3,844 in the 2026 file, is the only grade in the district that is materially larger than it was in 2010. Whether those students remain in the district through Kindergarten and the elementary grades will shape the next part of the trend.
Fernandez's point about immigration policy suggests a second line to watch: the English-language learner count. It has roughly doubled as a share of the district since 2010, and it is the part of enrollment where a slowdown in new arrivals would likely show up first.
The other variable is what happens on the Newark side. Newark's first single-year loss in seven years arrived in fall 2025. If that turns out to be a one-year correction, the two-district divergence will continue, and Jersey City may slip further down the size ranking. If Newark's pause turns into a plateau, the structural pressures that have produced Jersey City's slow decline may turn out to be regional, not local, and the story of urban Hudson County in 2026 may begin to look more like the story of urban America in 2026 than the New Jersey enrollment file alone has so far suggested.
Detailed code that reproduces the analysis and figures in this article is available exclusively to EdTribune subscribers.
Discussion
Sign in to join the discussion.
Loading comments...