In this series: The NJEdTribune examines New Jersey's latest enrollment decline, the districts defying it, and the demographic shifts underneath the statewide total.
Correction (July 20, 2026): An earlier version described 663 as the number of districts reporting 2025-26 enrollment. The package contains 665 reporting districts; 663 have a valid prior-year comparison. The published count of 414 shrinking districts and its rounded 62% share use that comparable panel and are unchanged. Re-running the stated five-year linear model also corrected the 2035-36 kindergarten projection from 78,600 to approximately 92,900 and the projected K/12 ratio from 0.78 to 0.71.
New Jersey recently released its 2025-26 fall enrollment file. The figures below come from the state's published enrollment reports and cover the 27 academic years from 1999-2000 through 2025-26. This piece is the data overview for the EdTribune's 2025-26 New Jersey enrollment series. It does not interpret the numbers. Subsequent articles in the series will.
The headline numbers
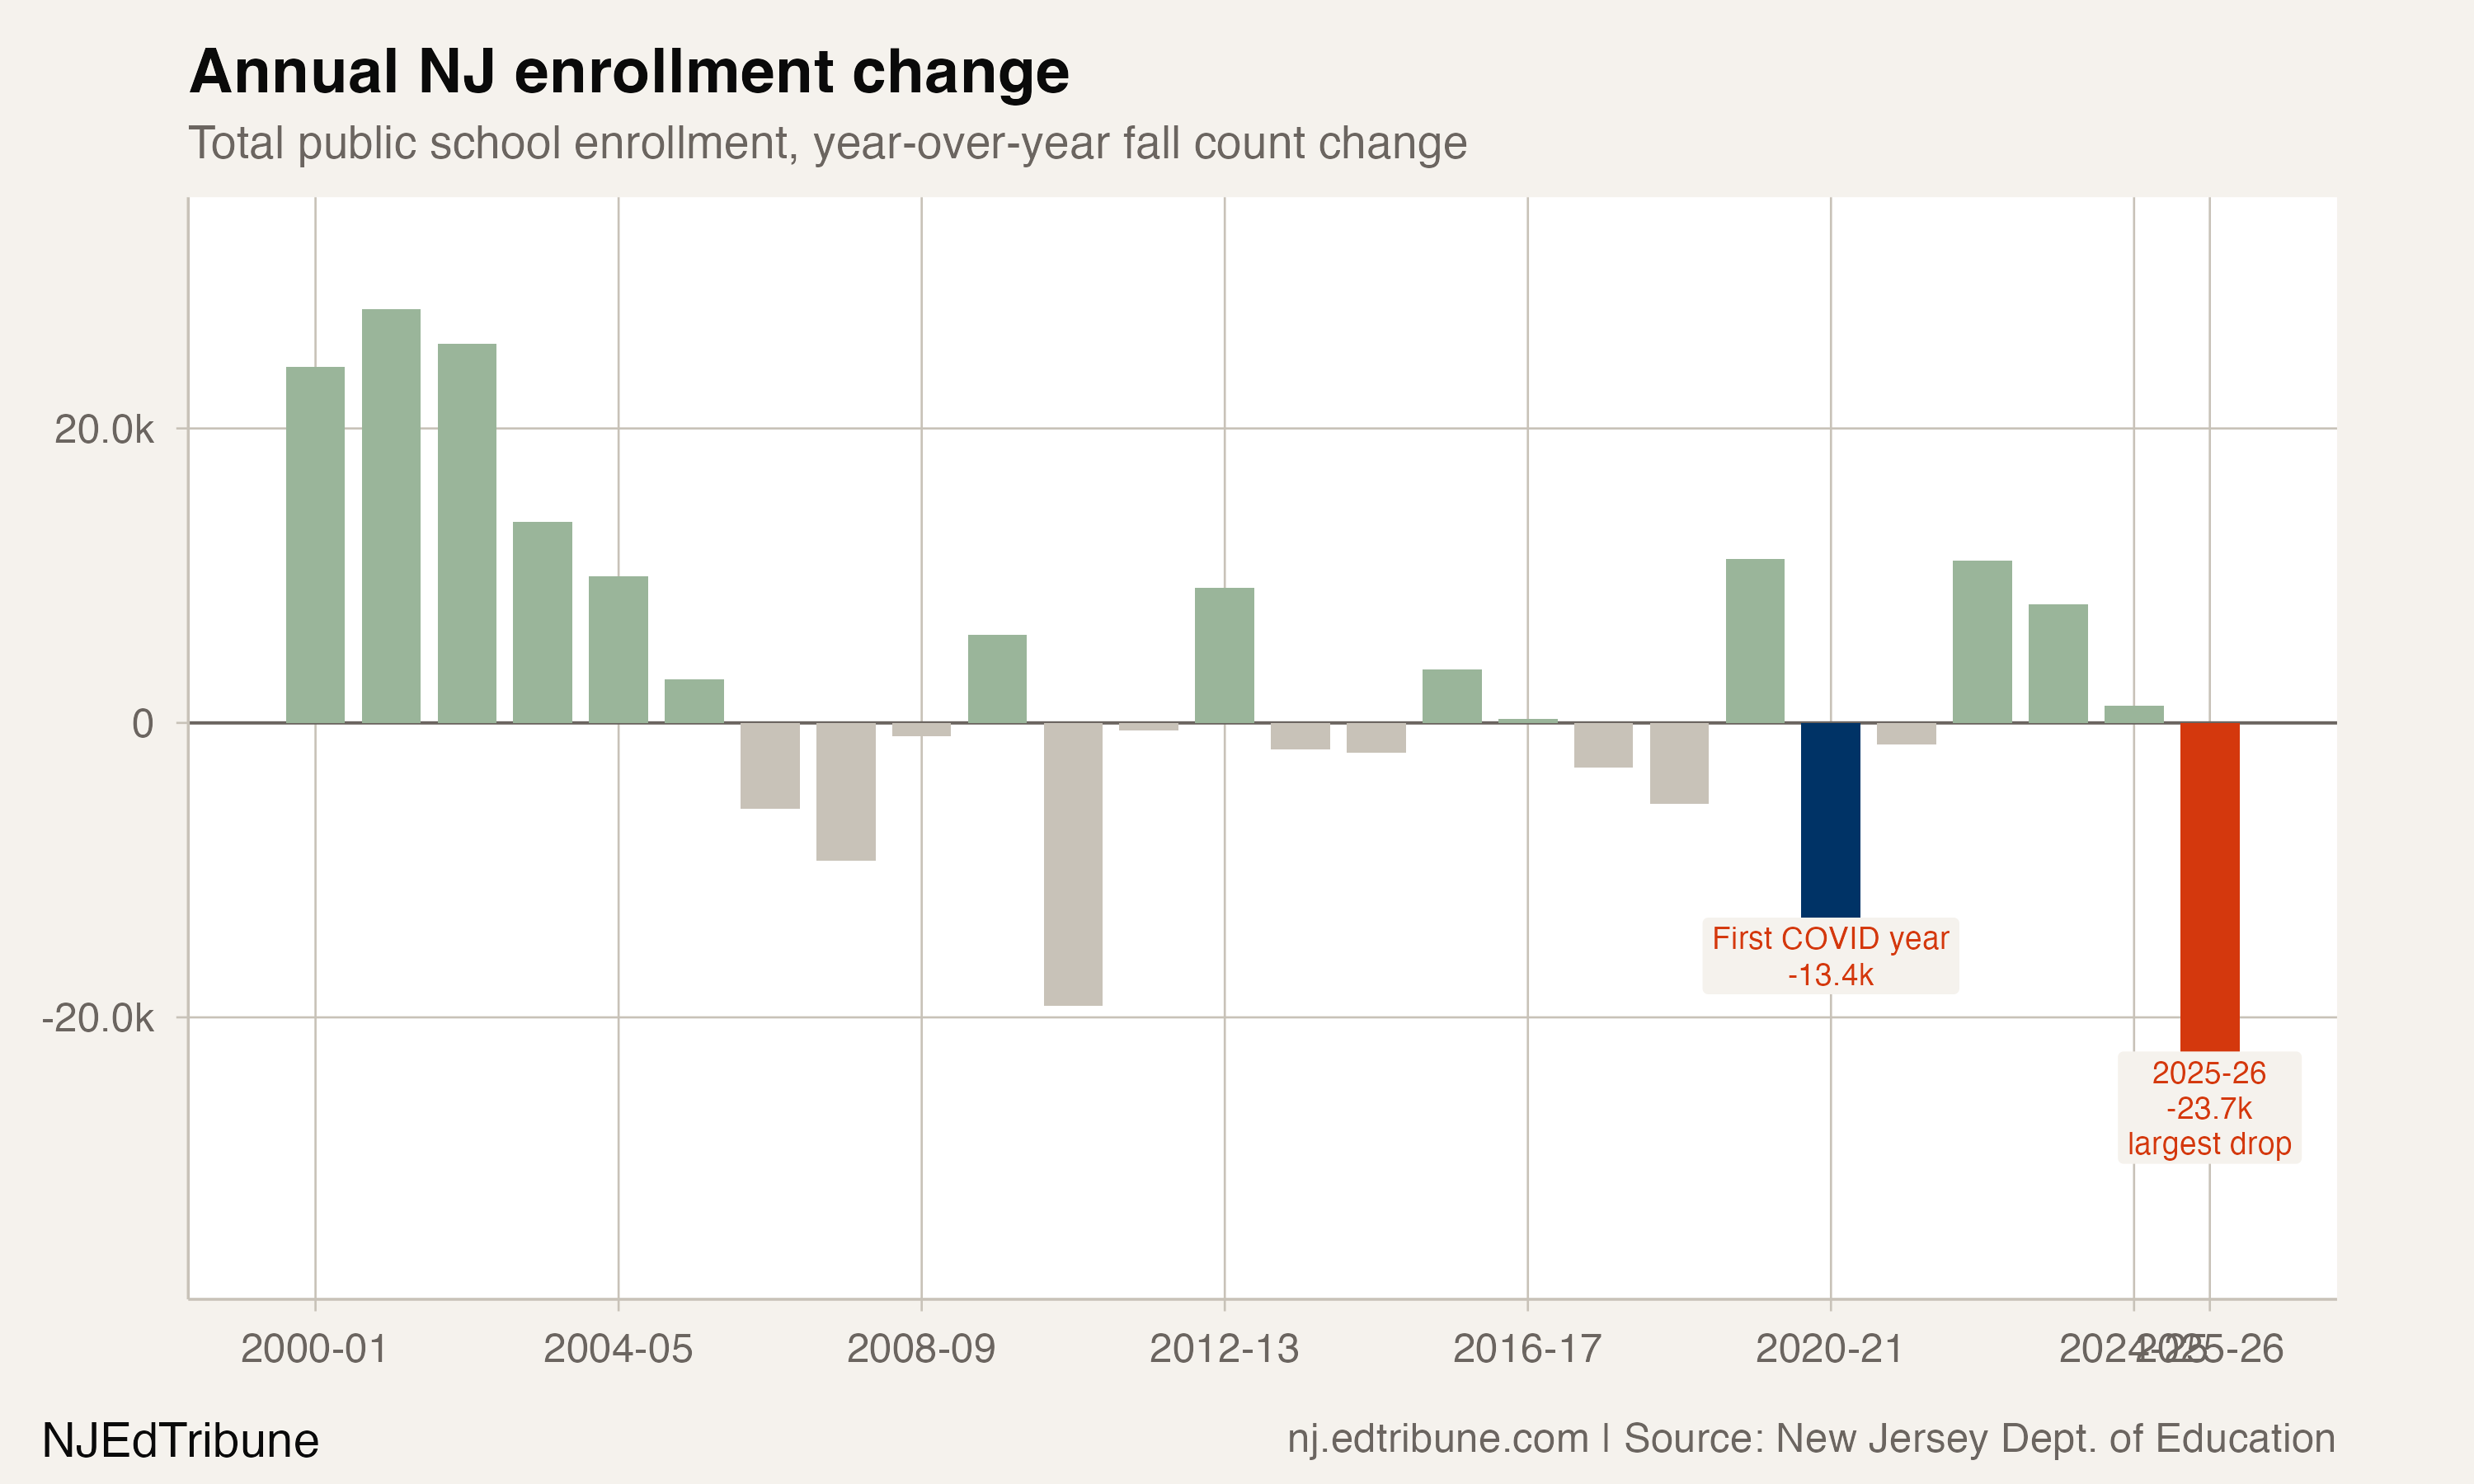
Total enrollment in 2025-26 was 1,357,450, down 23,732 students (-1.72%) from 2024-25. That is the largest single-year decline in the 27-year window of state files. It is also the lowest annual total since the 2001-02 school year (the 2002-03 total was 1,367,249, slightly above this year's figure).
Stripping pre-kindergarten out for a consistent K-12 measure across the full 27-year panel, K-12 enrollment fell 24,564 students (-1.9%), from 1,293,951 in 2024-25 to 1,269,386 in 2025-26. The first COVID year (2019-20 to 2020-21) saw a K-12 decline of 24,811 (-1.86%). The 2025-26 K-12 decline is virtually identical in size.
District breadth: 665 districts report 2025-26 enrollment, and 663 have a valid prior-year comparison. Of that comparable panel, 414 (62%) shrank year-over-year. The decline is broad rather than concentrated.
Pre-kindergarten was the only growing segment. PK rose by 832 students this year and is up 46,857 students (+113.7%) since 2018-19. The PK gain absorbed about 3% of the K-12 loss.
| Measure | 2024-25 | 2025-26 | Change |
|---|---|---|---|
| Total enrollment | 1,381,182 | 1,357,450 | -23,732 (-1.72%) |
| K-12 (total minus PK) | 1,293,951 | 1,269,386 | -24,564 (-1.90%) |
| Pre-K | 87,231 | 88,063 | +832 (+1.0%) |
| Kindergarten | 89,428 | 86,554 | -2,874 (-3.21%) |
| 12th grade | 107,048 | 105,879 | -1,169 (-1.09%) |
| Hispanic | 483,504 | 477,187 | -6,318 (-1.31%) |
| English learners (LEP) | 155,304 | 152,211 | -3,093 (-1.99%) |
| Districts that shrank YoY | 355 of 666 | 414 of 663 | n/a |
Hispanic and English-learner reversals
Hispanic enrollment in 2025-26 was 477,187, down 6,318 students (-1.31%) from 2024-25. This is the first annual decline in the 27-year state file panel. From 2000-01 through 2024-25, Hispanic enrollment grew every single year, averaging roughly 11,700 additional students per year over that span.
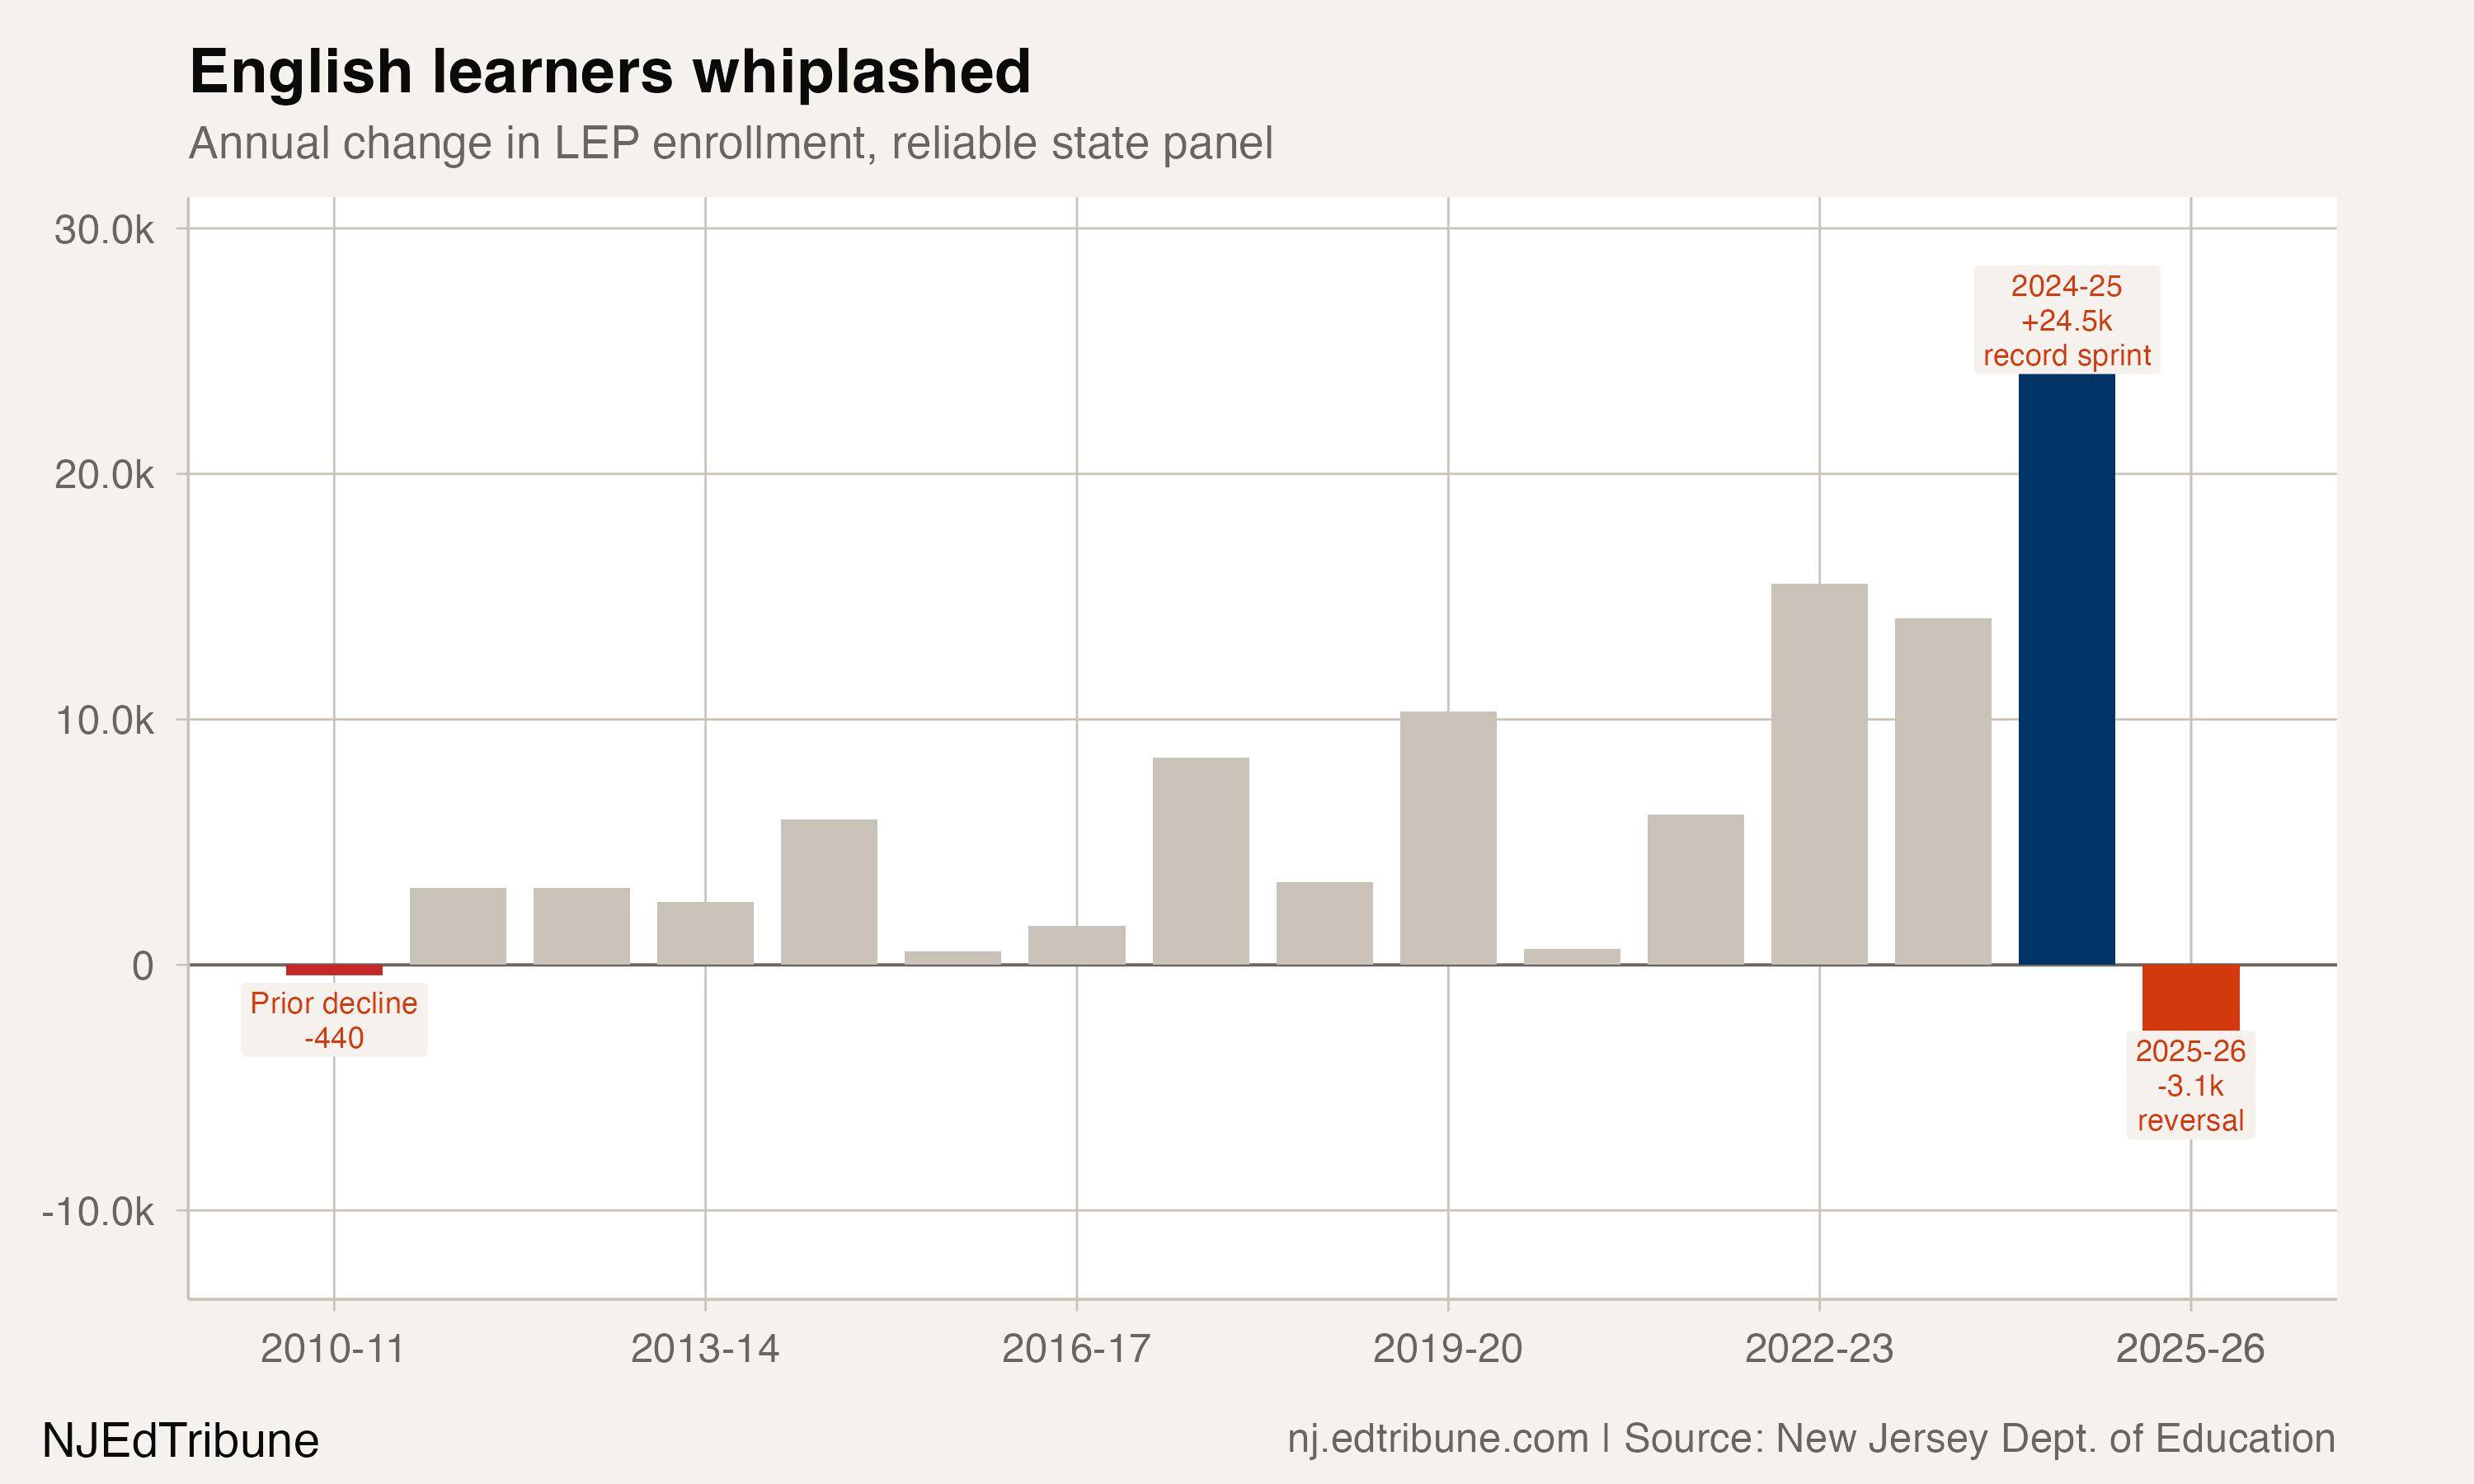
English-learner enrollment was 152,211 in 2025-26, down 3,093 students (-1.99%) from 2024-25. The previous annual decline was in 2010-11 (-440), and before that in 2007-08 (-2,444). The 2024-25 figure had been a record sprint of +24,481 students (+18.7%) over the prior year. The 2025-26 figure is the first reversal in this measure since 2010-11.
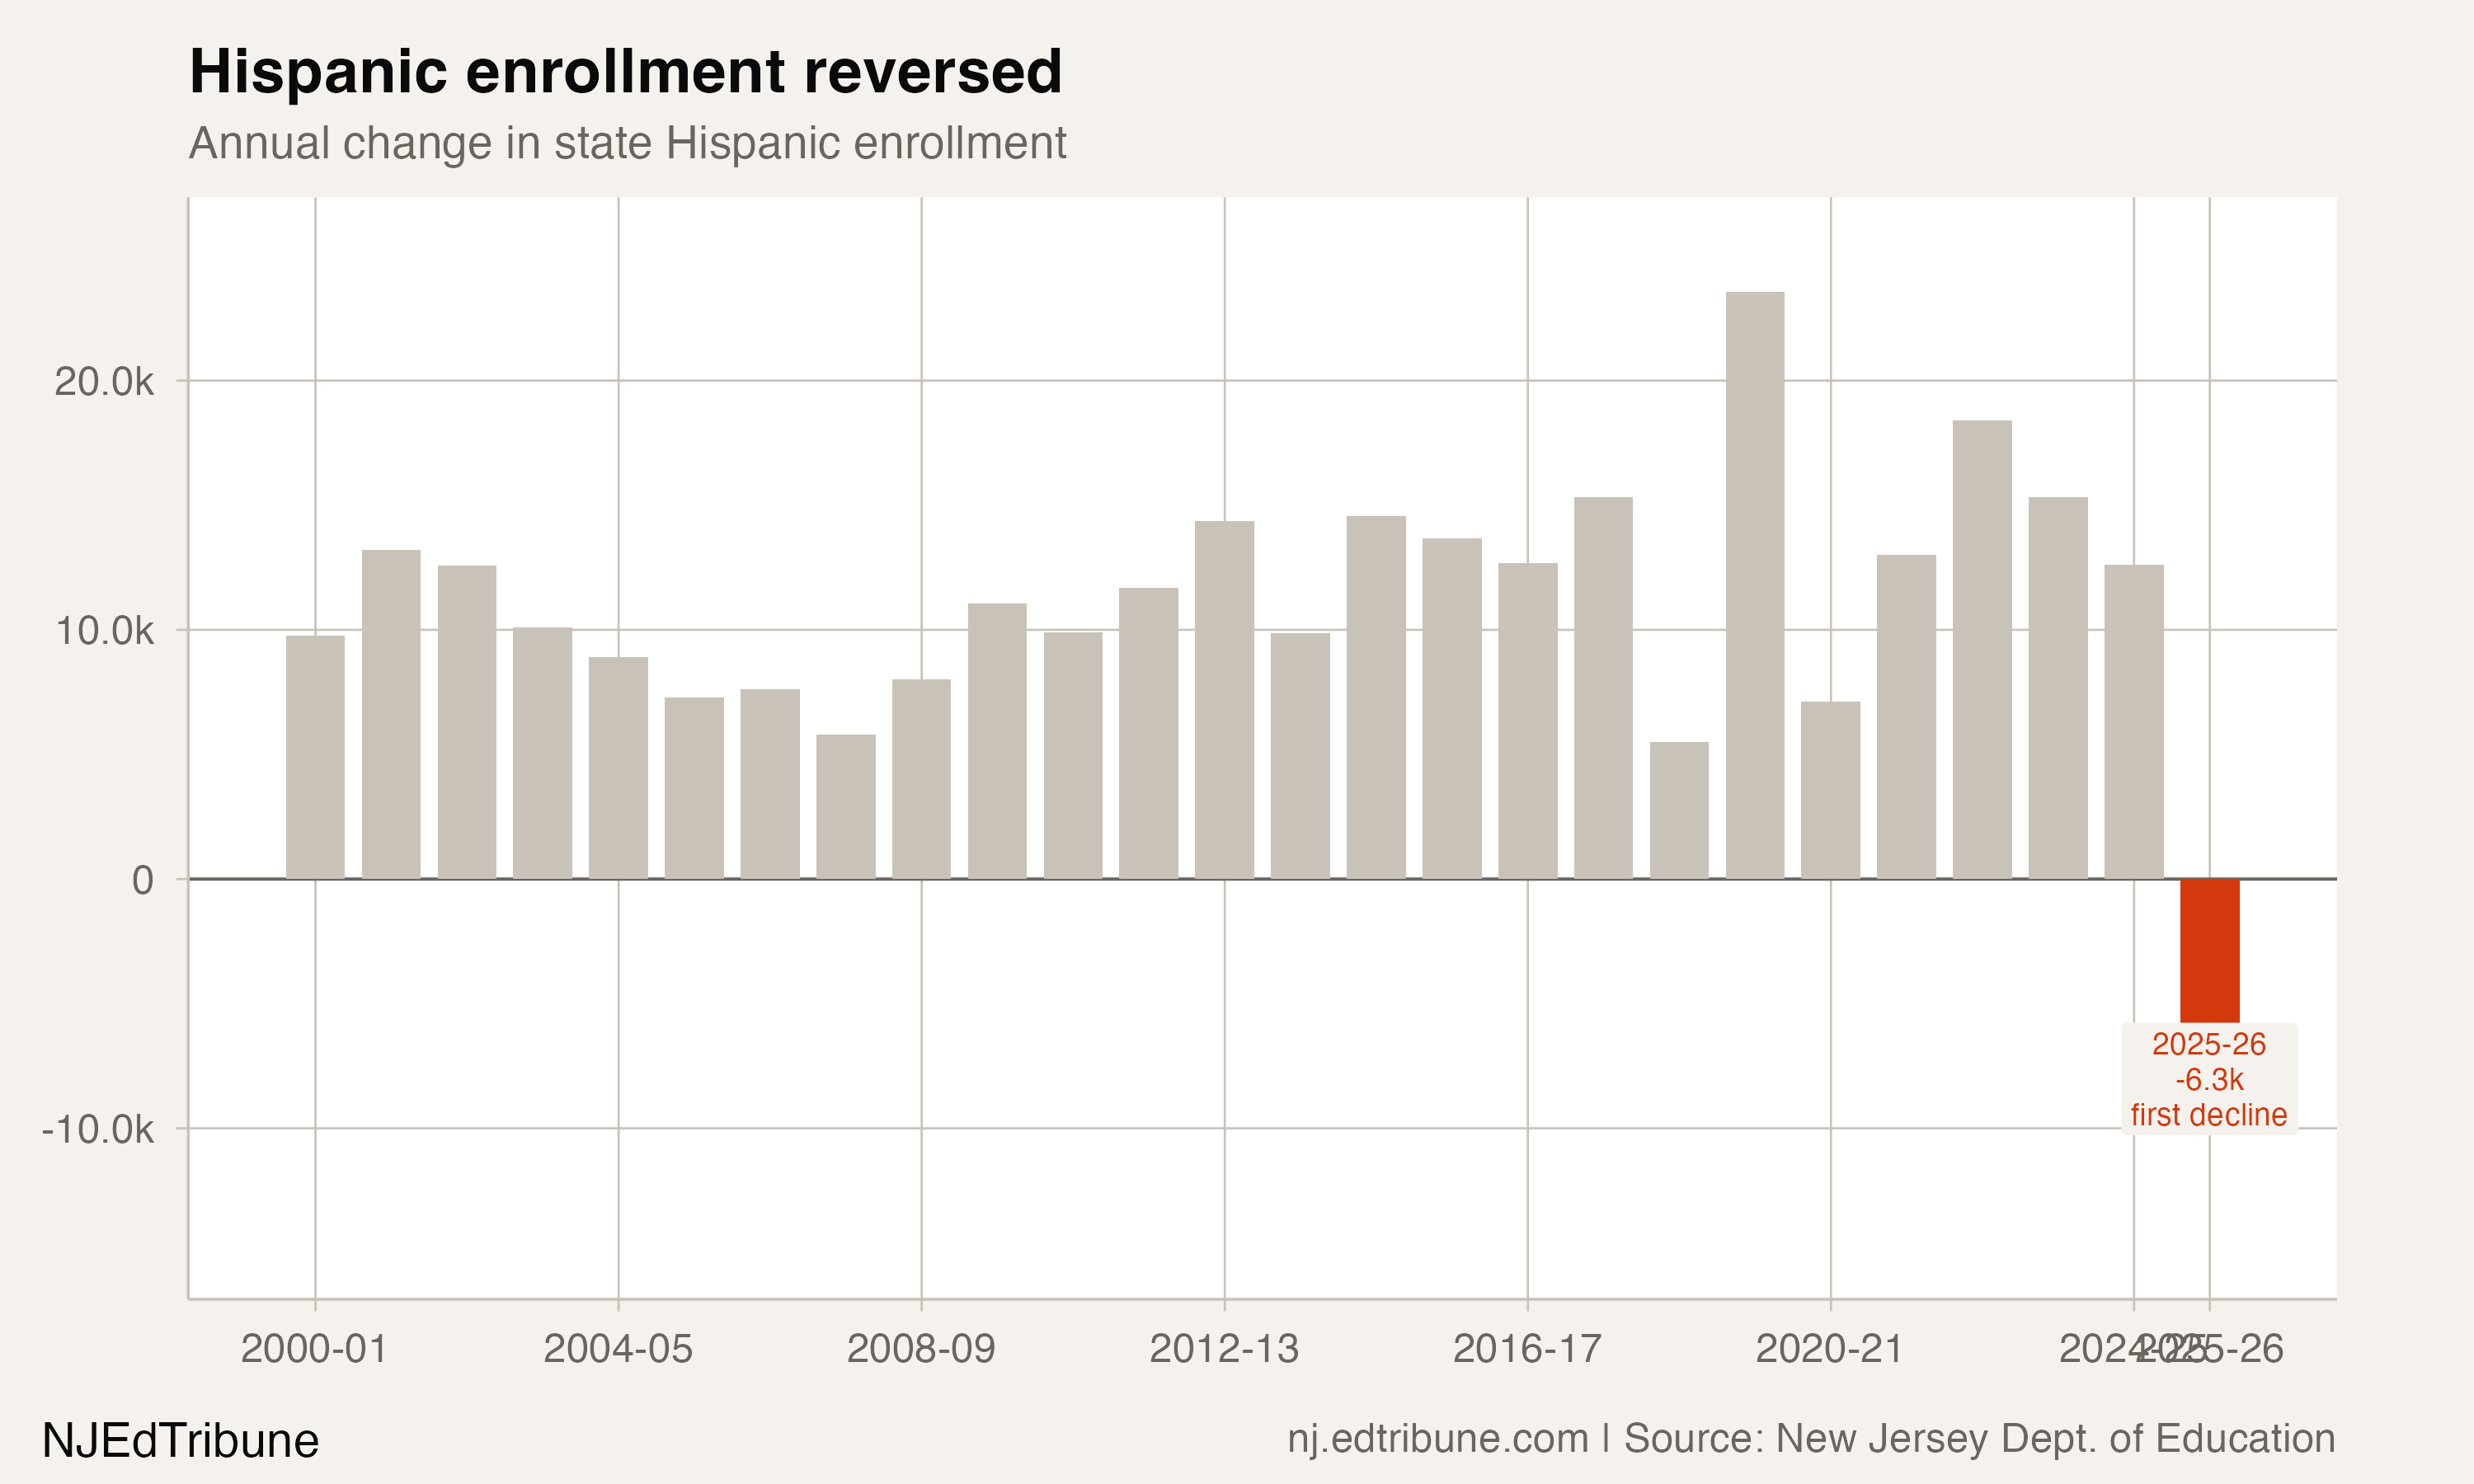
The Hispanic decline concentrates in the state's 20 largest Hispanic-enrollment districts. In 2024-25, those 20 districts collectively added 1,371 Hispanic students; 9 of 20 had grown. In 2025-26, the same 20 districts collectively lost 5,628 Hispanic students, and 13 of 20 lost Hispanic students year-over-year. The aggregate flipped from net positive to net negative in a single year.
| Top-20 Hispanic-enrollment districts (2025-26) | 2024-25 Hisp. change | 2025-26 Hisp. change |
|---|---|---|
| Newark Public School District | +1,669 | +460 |
| Elizabeth Public Schools | +88 | -1,002 |
| Paterson Public School District | -242 | -1,138 |
| Union City School District | -63 | -612 |
| Passaic City School District | -311 | -709 |
| Trenton Public School District | +612 | -827 |
| Jersey City Public Schools | -134 | -321 |
| Perth Amboy Public School District | -138 | -119 |
| Plainfield Public School District | -213 | -398 |
| New Brunswick School District | -384 | -488 |
| West New York School District | -60 | -485 |
| Clifton Public School District | +40 | -108 |
| Vineland Public School District | -43 | -119 |
| North Bergen School District | -34 | -145 |
| Hamilton Township Public School District | +274 | +92 |
| Bridgeton City School District | -21 | +198 |
| Woodbridge Township School District | +78 | +9 |
| Toms River Regional School District | +153 | +54 |
| Kearny | +94 | +23 |
| Belleville Public School District | +6 | +7 |
| Top-20 aggregate | +1,371 | -5,628 |
Kindergarten and the K-to-12th-grade ratio
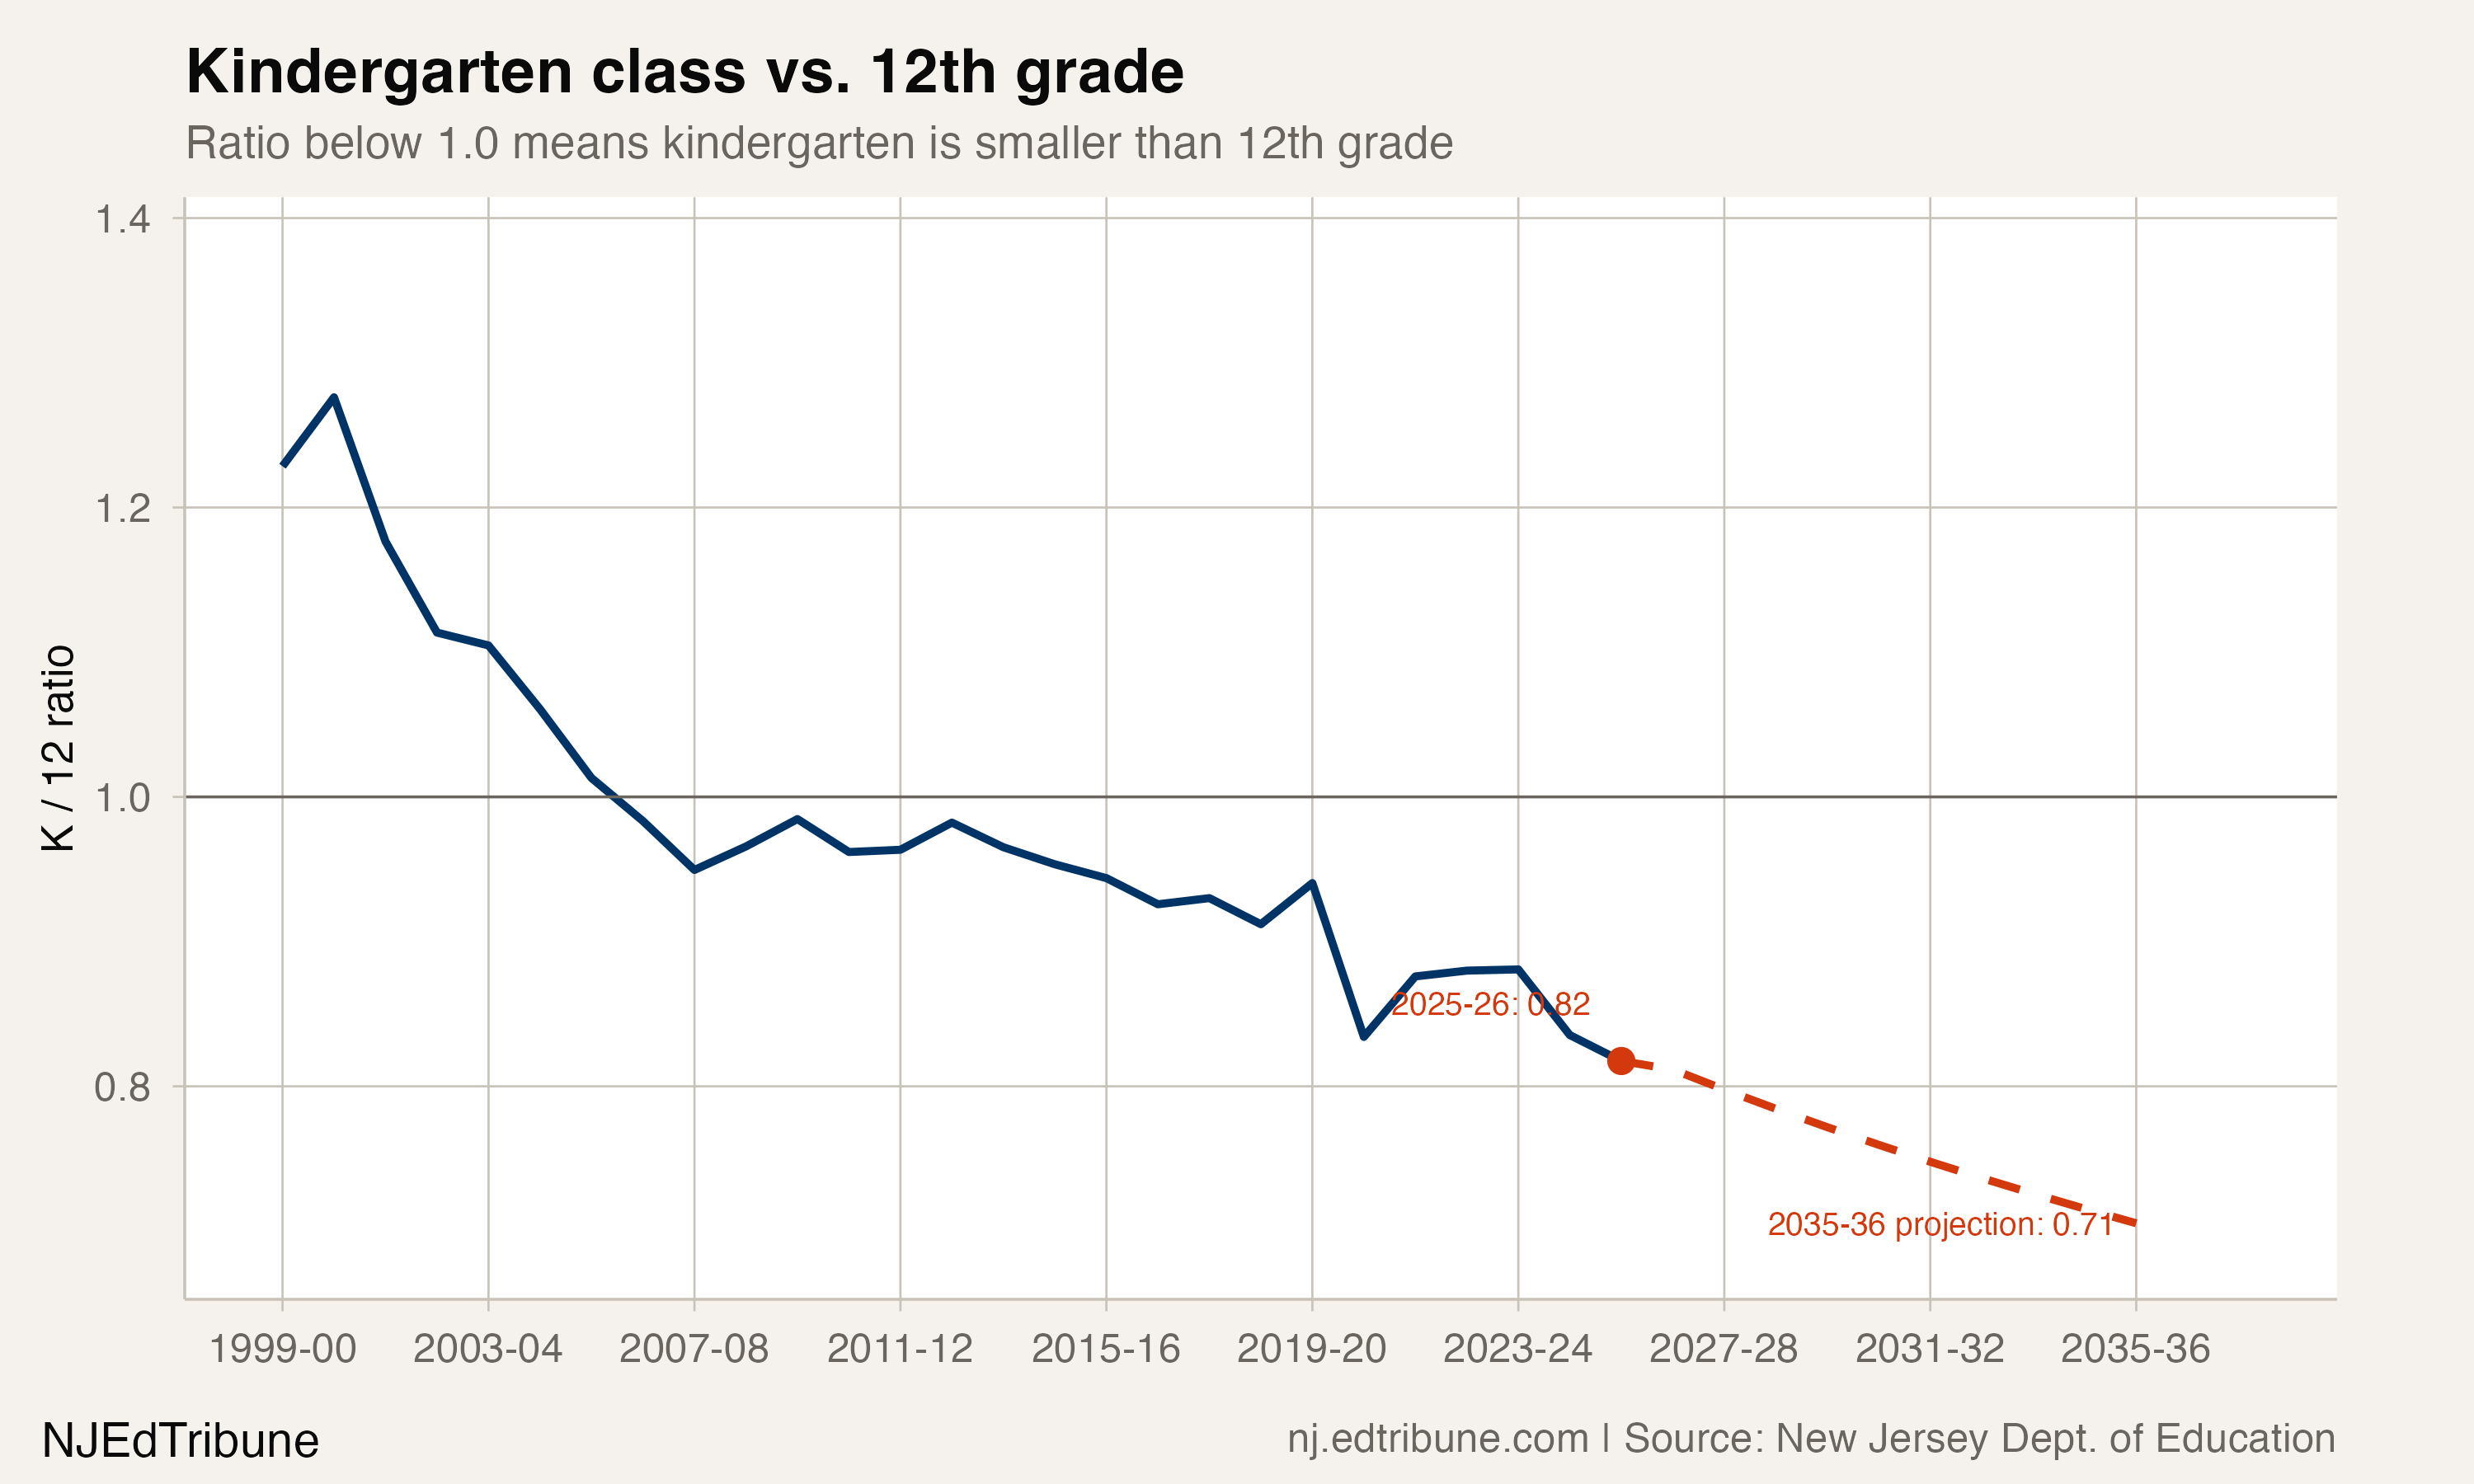
Kindergarten enrollment was 86,554 in 2025-26, down 2,874 (-3.21%) from 2024-25. The K-to-12 ratio (kindergarten count divided by 12th-grade count) was 0.82 in 2025-26, the lowest in 27 years of state files.
For context, the K/12 ratio in 1999-00, the earliest year in the current state files, was 1.23. The ratio peaked at 1.28 in 2000-01. A ratio of 1.00 means the kindergarten class equals the graduating class. New Jersey's ratio first fell below 1.00 in 2006-07 and has not returned above it; in 2020-21 it dropped sharply to 0.83. In 2025-26, the kindergarten class is about 18% smaller than the graduating class.
A simple linear projection anchored to the most recent five years of K and 12th-grade trends would place the kindergarten cohort at roughly 90,700 by 2030-31 and 92,900 by 2035-36. The model projects 12th grade growing faster, taking the K/12 ratio to 0.71 by the latter year. This is an illustrative extrapolation, not a forecast of policy or demographic change.
State composition, 2009-10 vs. 2025-26
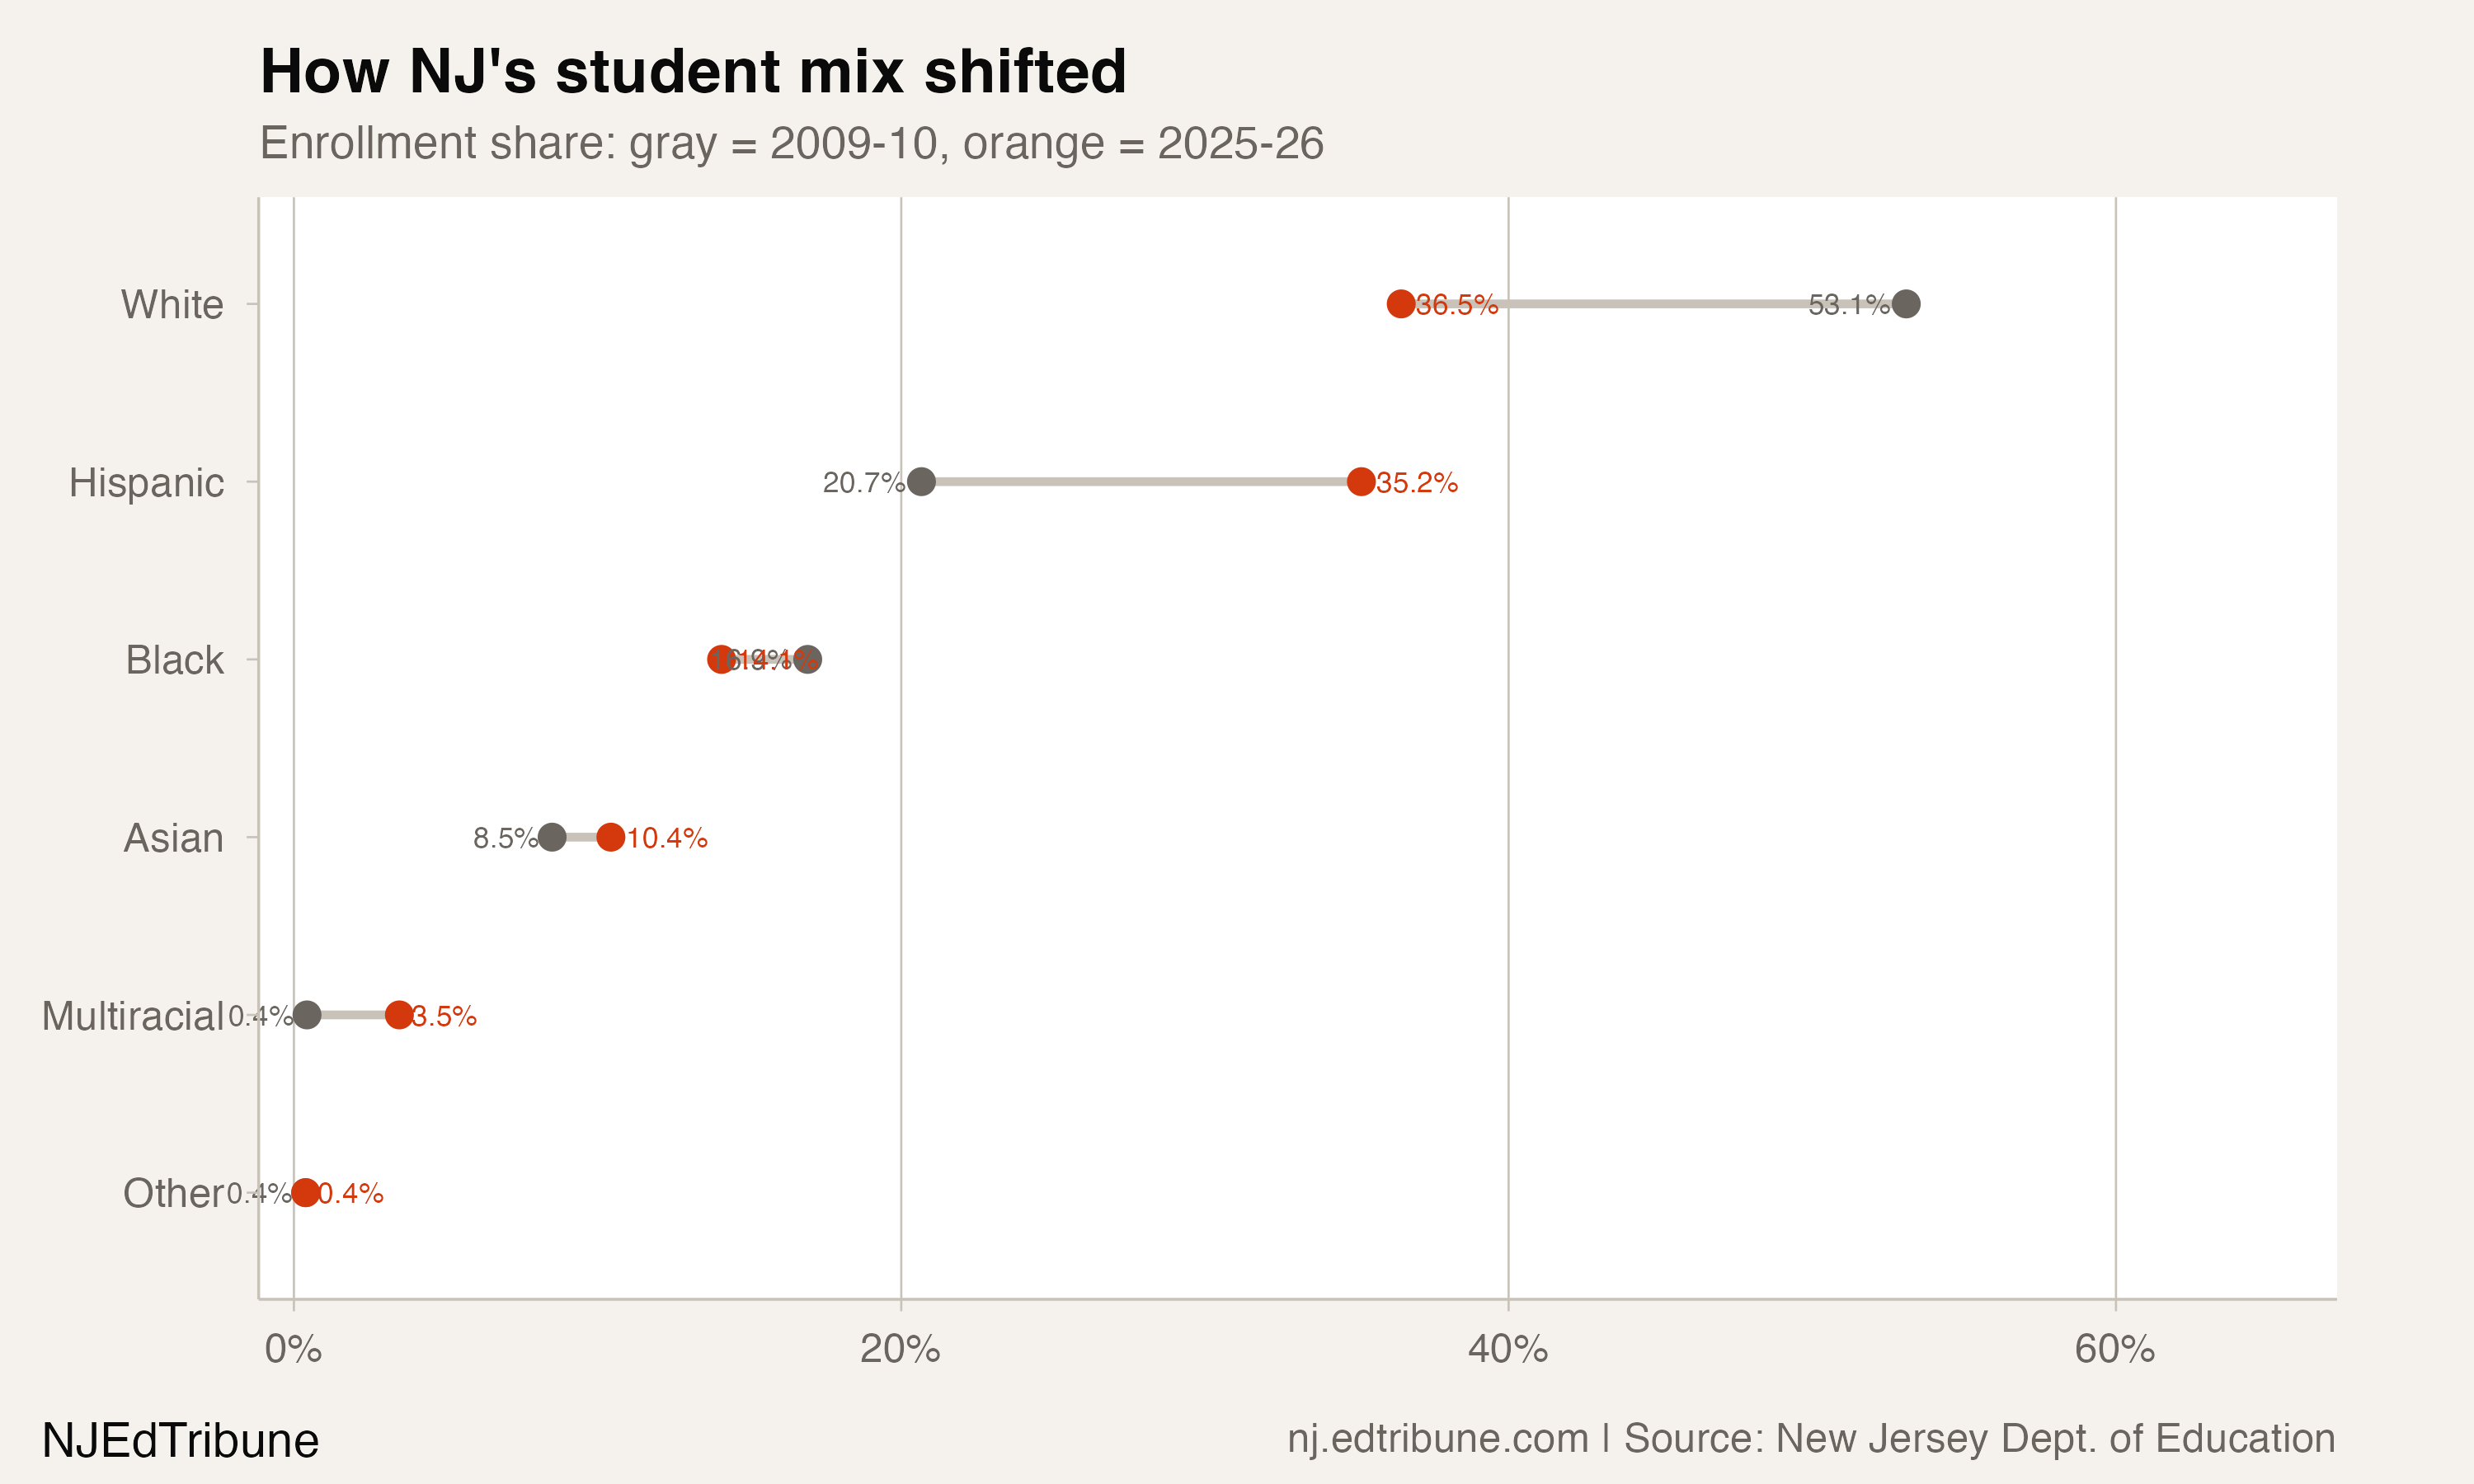
The state's detailed enrollment tables run from 2009-10 forward. The two snapshots below cover the most recent 17 years.
By race and ethnicity
| Group | 2009-10 students | 2009-10 share | 2025-26 students | 2025-26 share | Absolute change |
|---|---|---|---|---|---|
| White | 734,665 | 53.1% | 494,974 | 36.5% | -239,690 |
| Hispanic | 285,946 | 20.7% | 477,187 | 35.2% | +191,241 |
| Black | 234,112 | 16.9% | 191,180 | 14.1% | -42,932 |
| Asian | 117,656 | 8.5% | 141,702 | 10.4% | +24,046 |
| Multiracial | 5,969 | 0.4% | 47,160 | 3.5% | +41,190 |
| Native American | 2,733 | 0.2% | 2,881 | 0.2% | +148 |
| Pacific Islander | 2,627 | 0.2% | 2,365 | 0.2% | -262 |
(Multiracial counts climbed from 5,970 in 2009-10 to 13,801 in 2012-13 and continued rising afterward.)
By special population
| Population | 2009-10 | 2025-26 | Change |
|---|---|---|---|
| English learners (LEP) | 55,803 | 152,211 | +96,408 |
| Free lunch | 358,912 | 511,826 | +152,914 |
| Reduced-price lunch | 86,152 | 68,187 | -17,965 |
| Multiracial students | 5,969 | 47,160 | +41,191 |
Note: state-level free-lunch share rose from about 32% to about 37% between 2023-24 and 2024-25, the largest single-year shift in this measure in the 17-year window. [Suggestive context:] Expanded participation in the federal Community Eligibility Provision, which lets eligible schools and districts serve meals at no cost without household applications, could contribute to the jump. The enrollment file alone does not establish the cause, so year-over-year free-lunch comparisons across that boundary should be interpreted cautiously.
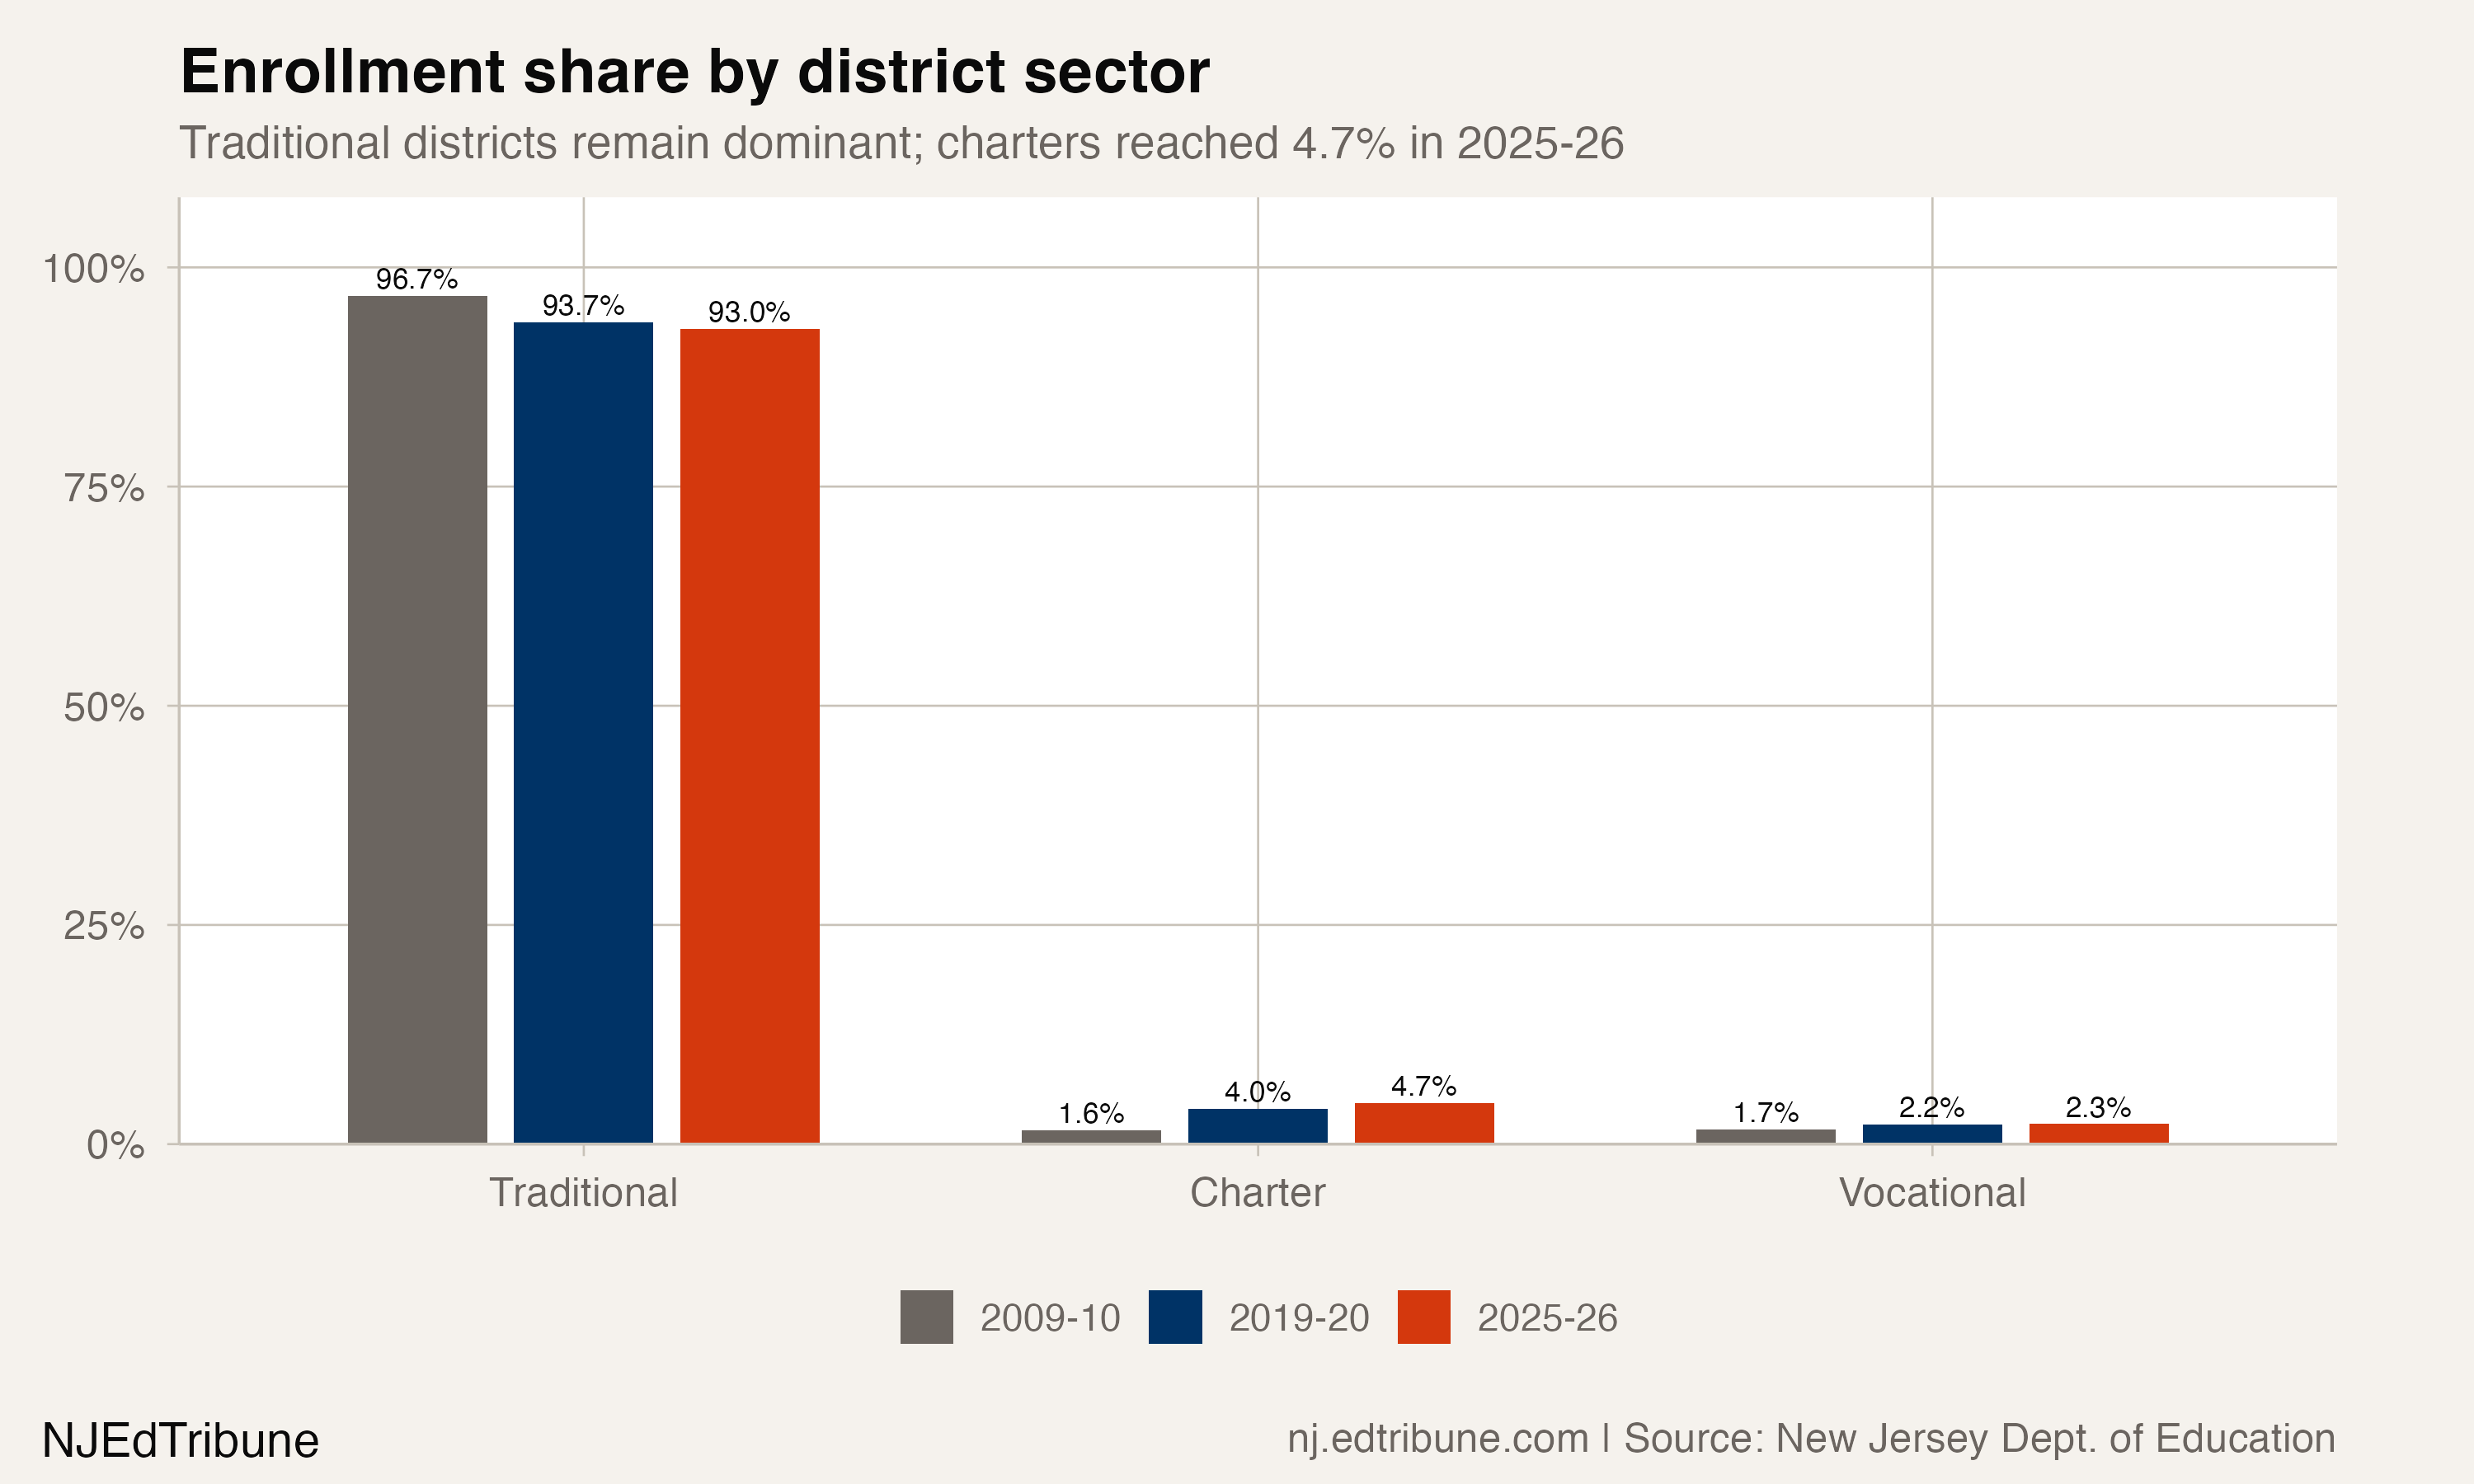
By district sector
| Sector | 2009-10 students | 2019-20 students | 2025-26 students | 2025-26 share |
|---|---|---|---|---|
| Traditional public districts | 1,338,414 | 1,289,592 | 1,262,234 | 93.0% |
| Charter schools | 21,686 | 55,604 | 64,037 | 4.7% |
| County vocational-technical districts | 23,606 | 30,634 | 31,178 | 2.3% |
Top 10 districts by 2025-26 enrollment
| Rank | District | 2009-10 | 2024-25 | 2025-26 | YoY | Change since 2009-10 |
|---|---|---|---|---|---|---|
| 1 | Newark Public School District | 39,440 | 43,980 | 43,216 | -764 (-1.7%) | +3,776 (+9.6%) |
| 2 | Elizabeth Public Schools | 21,743 | 27,979 | 26,708 | -1,271 (-4.5%) | +4,965 (+22.8%) |
| 3 | Jersey City Public Schools | 27,464 | 25,692 | 25,307 | -385 (-1.5%) | -2,157 (-7.9%) |
| 4 | Paterson Public School District | 24,080 | 23,609 | 21,849 | -1,760 (-7.5%) | -2,231 (-9.3%) |
| 5 | Edison Township School District | 14,215 | 16,708 | 16,191 | -517 (-3.1%) | +1,976 (+13.9%) |
| 6 | Trenton Public School District | 10,979 | 15,473 | 14,379 | -1,094 (-7.1%) | +3,400 (+31.0%) |
| 7 | Toms River Regional School District | 17,102 | 14,117 | 13,925 | -192 (-1.4%) | -3,177 (-18.6%) |
| 8 | Woodbridge Township School District | 13,105 | 13,870 | 13,425 | -445 (-3.2%) | +320 (+2.4%) |
| 9 | Hamilton Township Public School District | 12,757 | 12,194 | 12,112 | -82 (-0.7%) | -645 (-5.1%) |
| 10 | Union City School District | 10,224 | 12,617 | 12,006 | -611 (-4.8%) | +1,782 (+17.4%) |
County-level totals, 2009-10 to 2025-26
Aggregating district-level enrollment by the county where each district sits. The figures below exclude charter schools (which the state files group under a separate "Charters" pseudo-county).
Counties with the largest absolute gains
| County | 2009-10 | 2025-26 | Change | % change |
|---|---|---|---|---|
| Union | 87,317 | 95,696 | +8,379 | +9.6% |
| Essex | 119,443 | 125,813 | +6,370 | +5.3% |
| Hudson | 77,386 | 80,614 | +3,228 | +4.2% |
| Middlesex | 120,334 | 121,809 | +1,475 | +1.2% |
| Mercer | 57,780 | 58,960 | +1,179 | +2.0% |
Counties with the largest absolute declines
| County | 2009-10 | 2025-26 | Change | % change |
|---|---|---|---|---|
| Monmouth | 105,552 | 87,674 | -17,878 | -16.9% |
| Ocean | 75,759 | 63,831 | -11,927 | -15.7% |
| Morris | 80,127 | 72,082 | -8,045 | -10.0% |
| Passaic | 80,099 | 73,151 | -6,948 | -8.7% |
| Somerset | 55,006 | 48,696 | -6,310 | -11.5% |
Detailed code that reproduces the analysis and figures in this article is available exclusively to EdTribune subscribers.
Discussion
Sign in to join the discussion.
Loading comments...