In this series: The NJEdTribune examines New Jersey's latest enrollment decline, the districts defying it, and the demographic shifts underneath the statewide total.
Correction: An earlier version mixed charter district-total rows with their matching school rows, doubling the charter comparison. This version uses one published district-total row per stable charter district ID and removes causal claims that the enrollment data cannot establish.
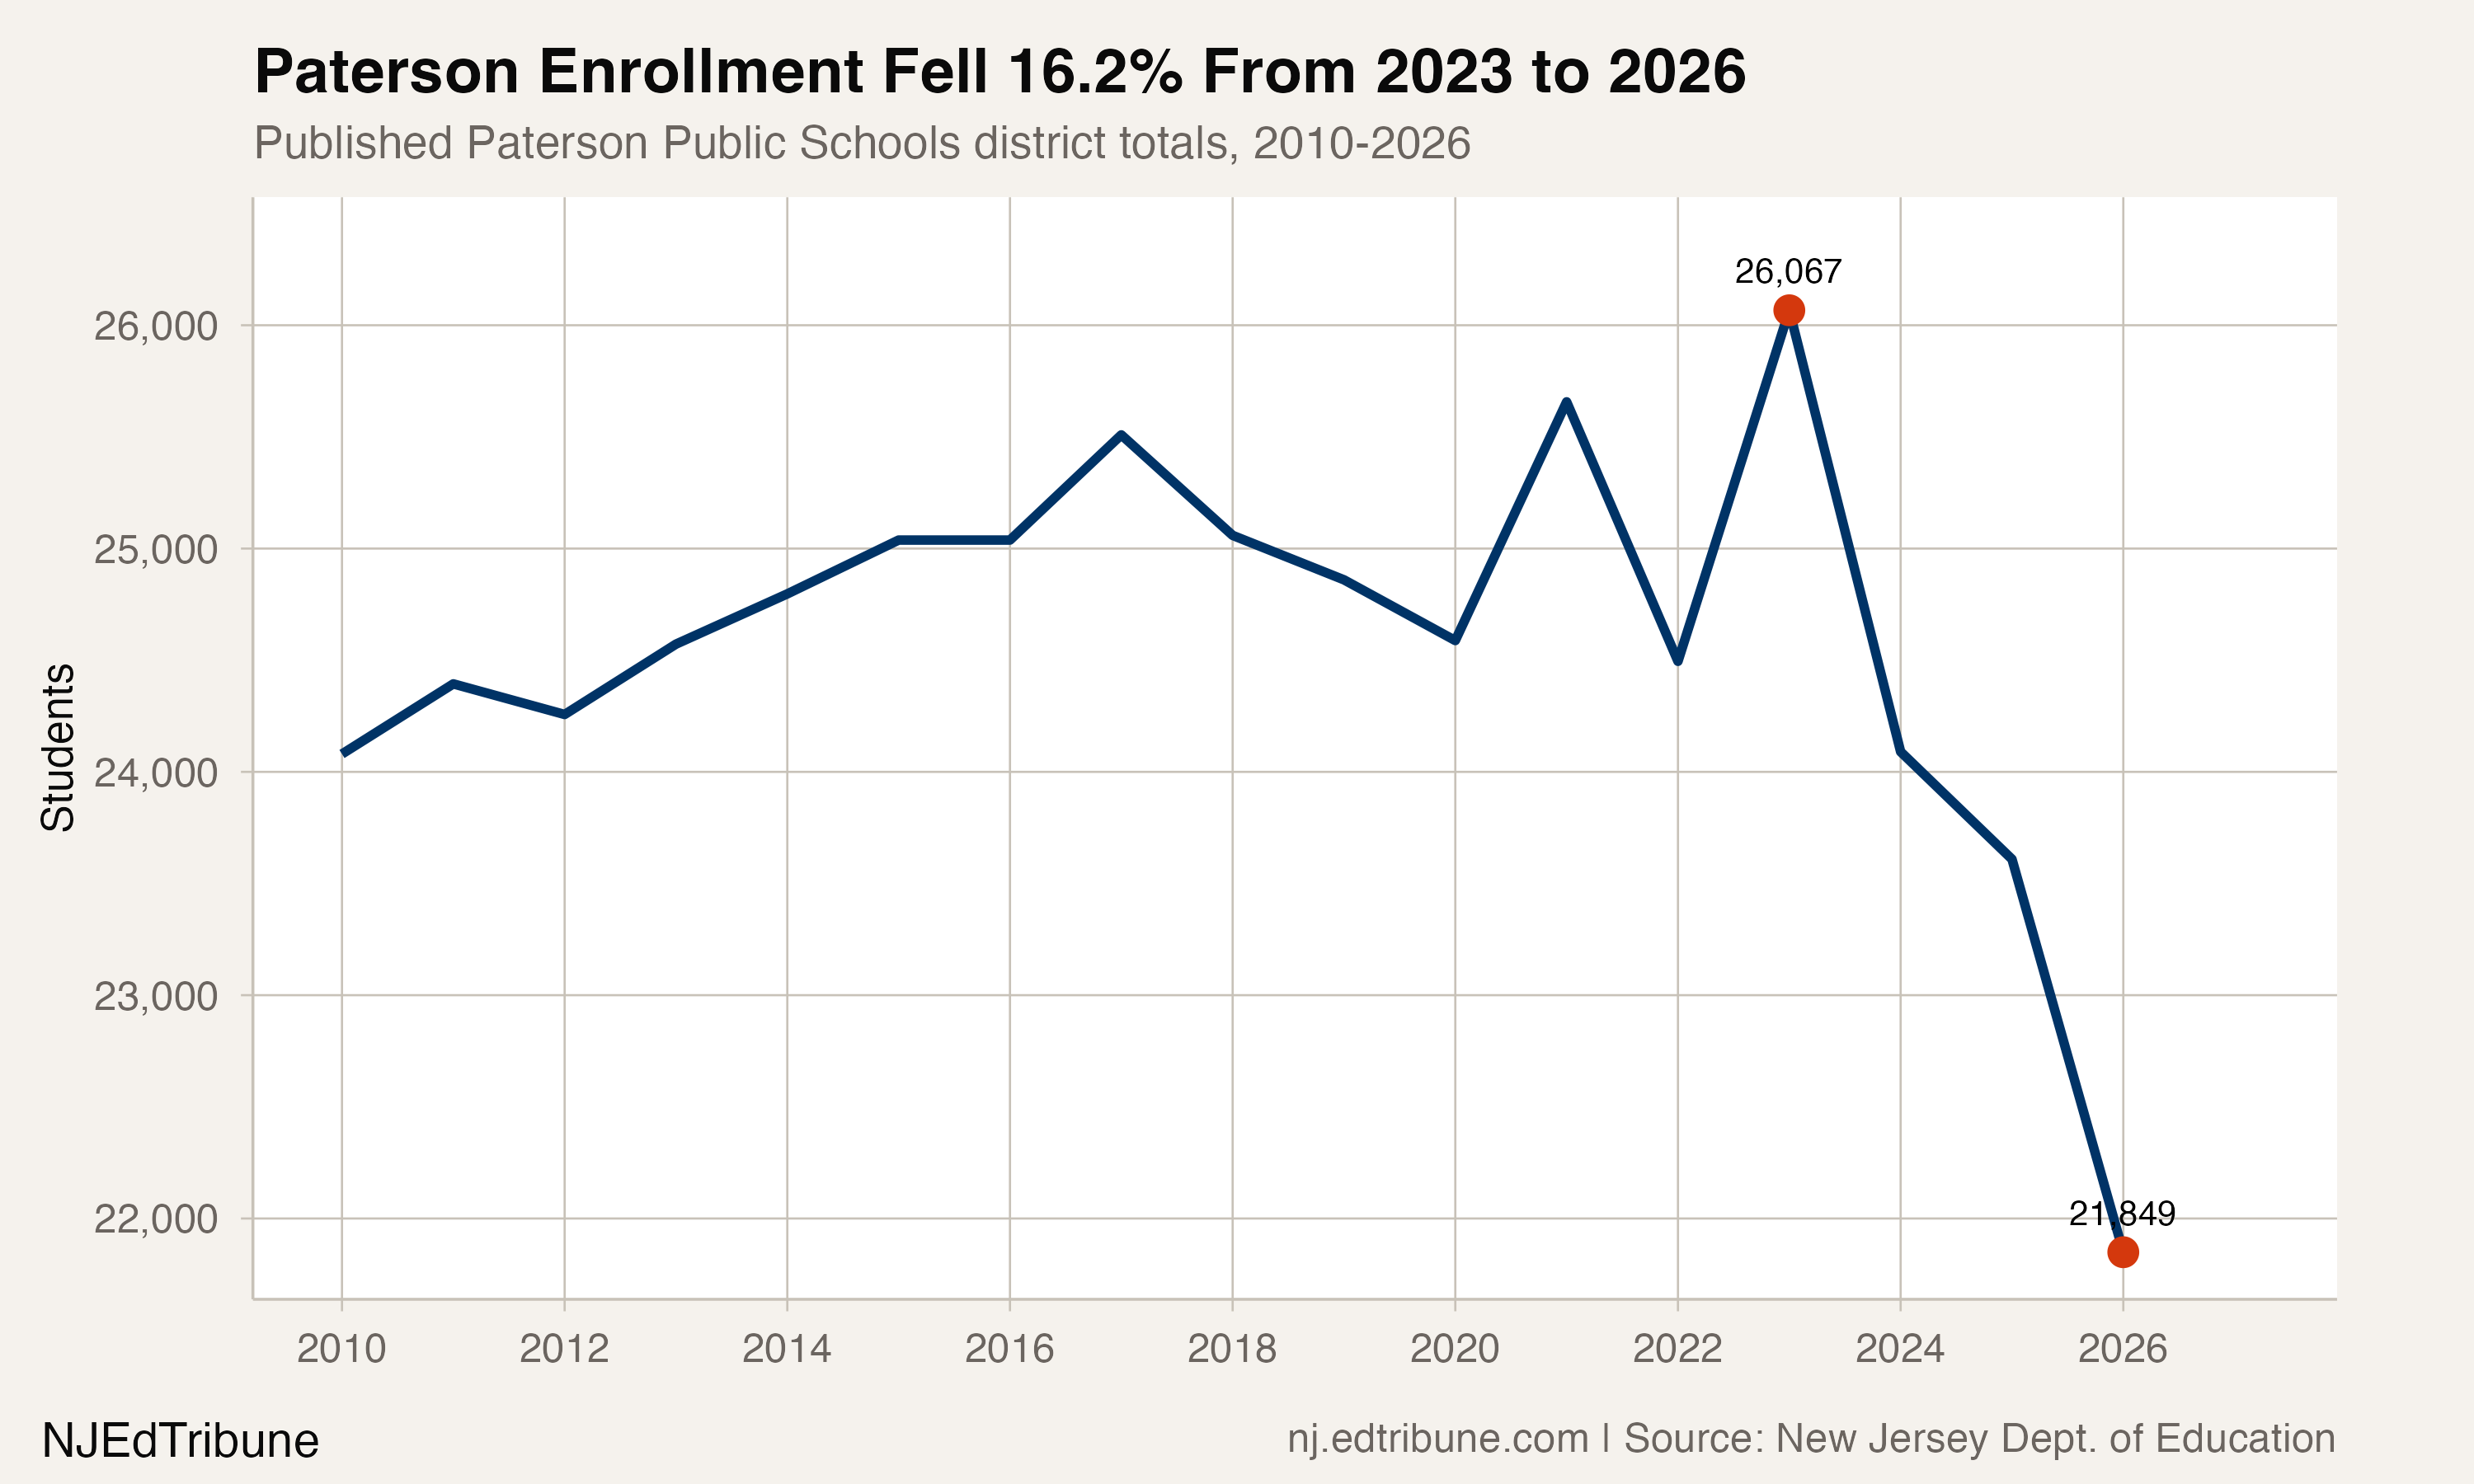
Paterson↗ET Public Schools enrolled 26,067 students in the school year ending in 2023. Three years later, the published district total was 21,849.
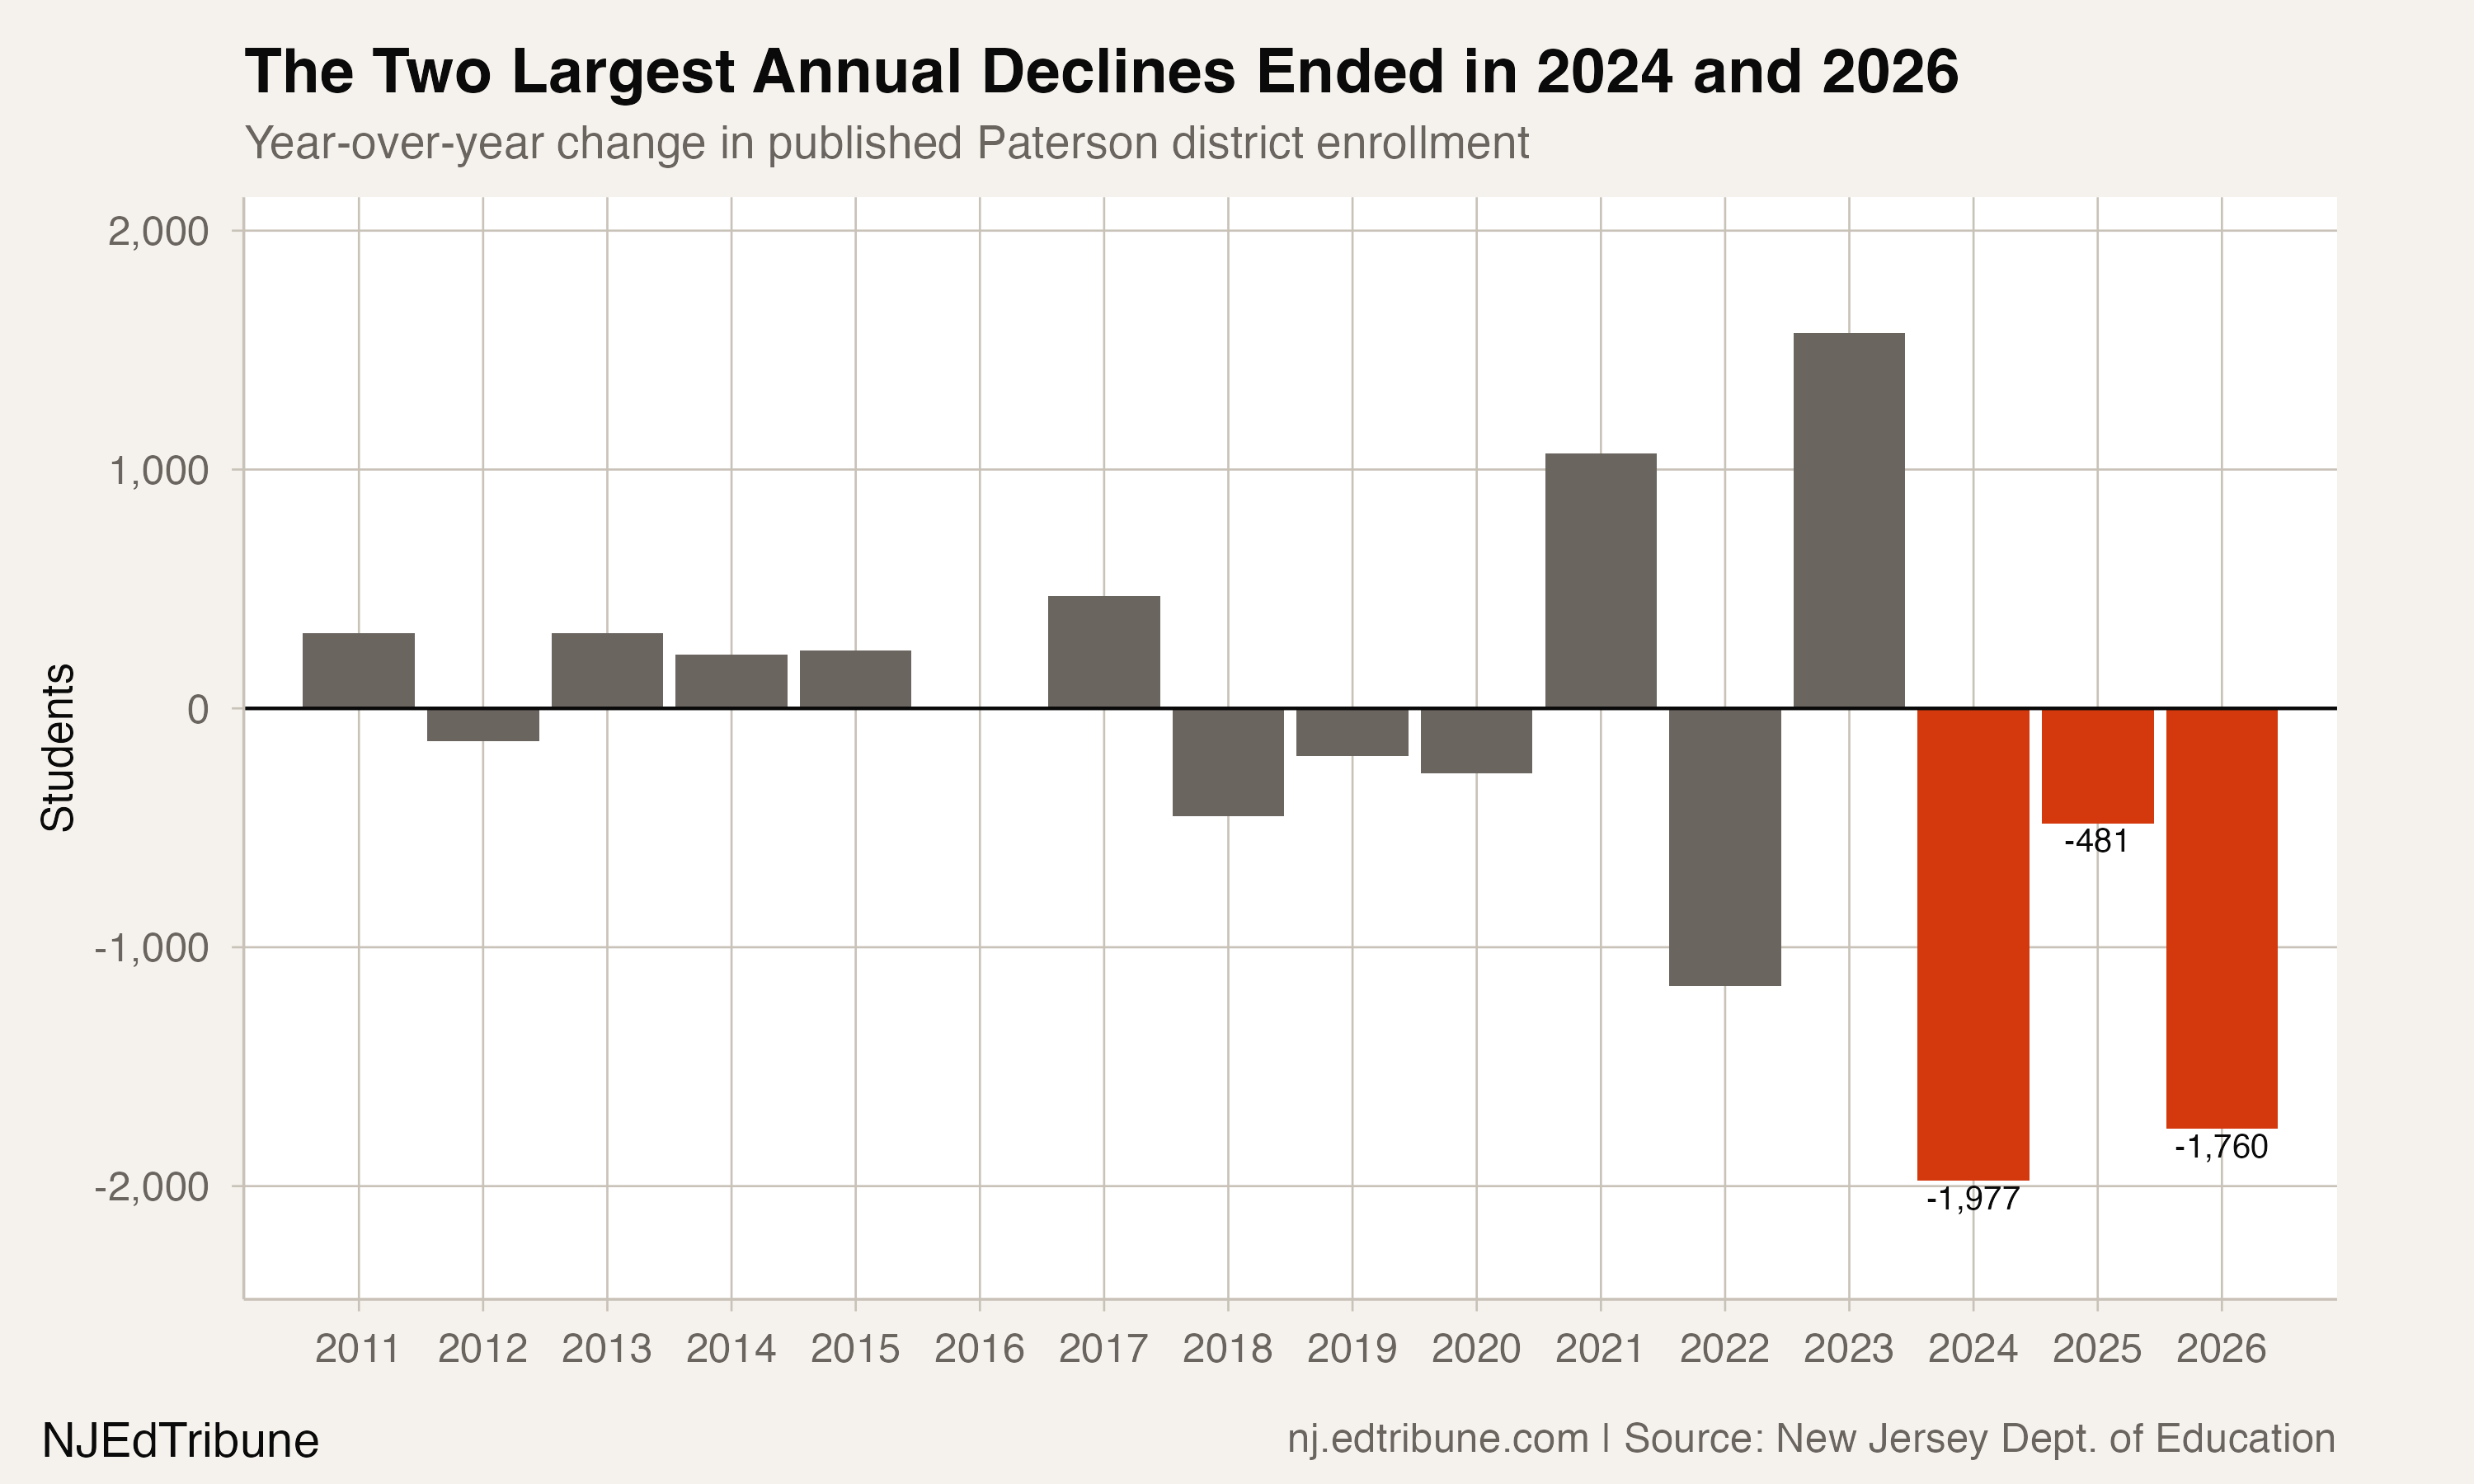
That is a loss of 4,218 students, or 16.2 percent. The district's annual decline was 1,977 students in 2024, 481 in 2025 and 1,760 in 2026.
Those figures come from a complete 17-year panel of published district totals from 2010 through 2026. The analysis follows Paterson's stable state district ID, 4010, across changes in its published name.
The largest decline among comparable large districts
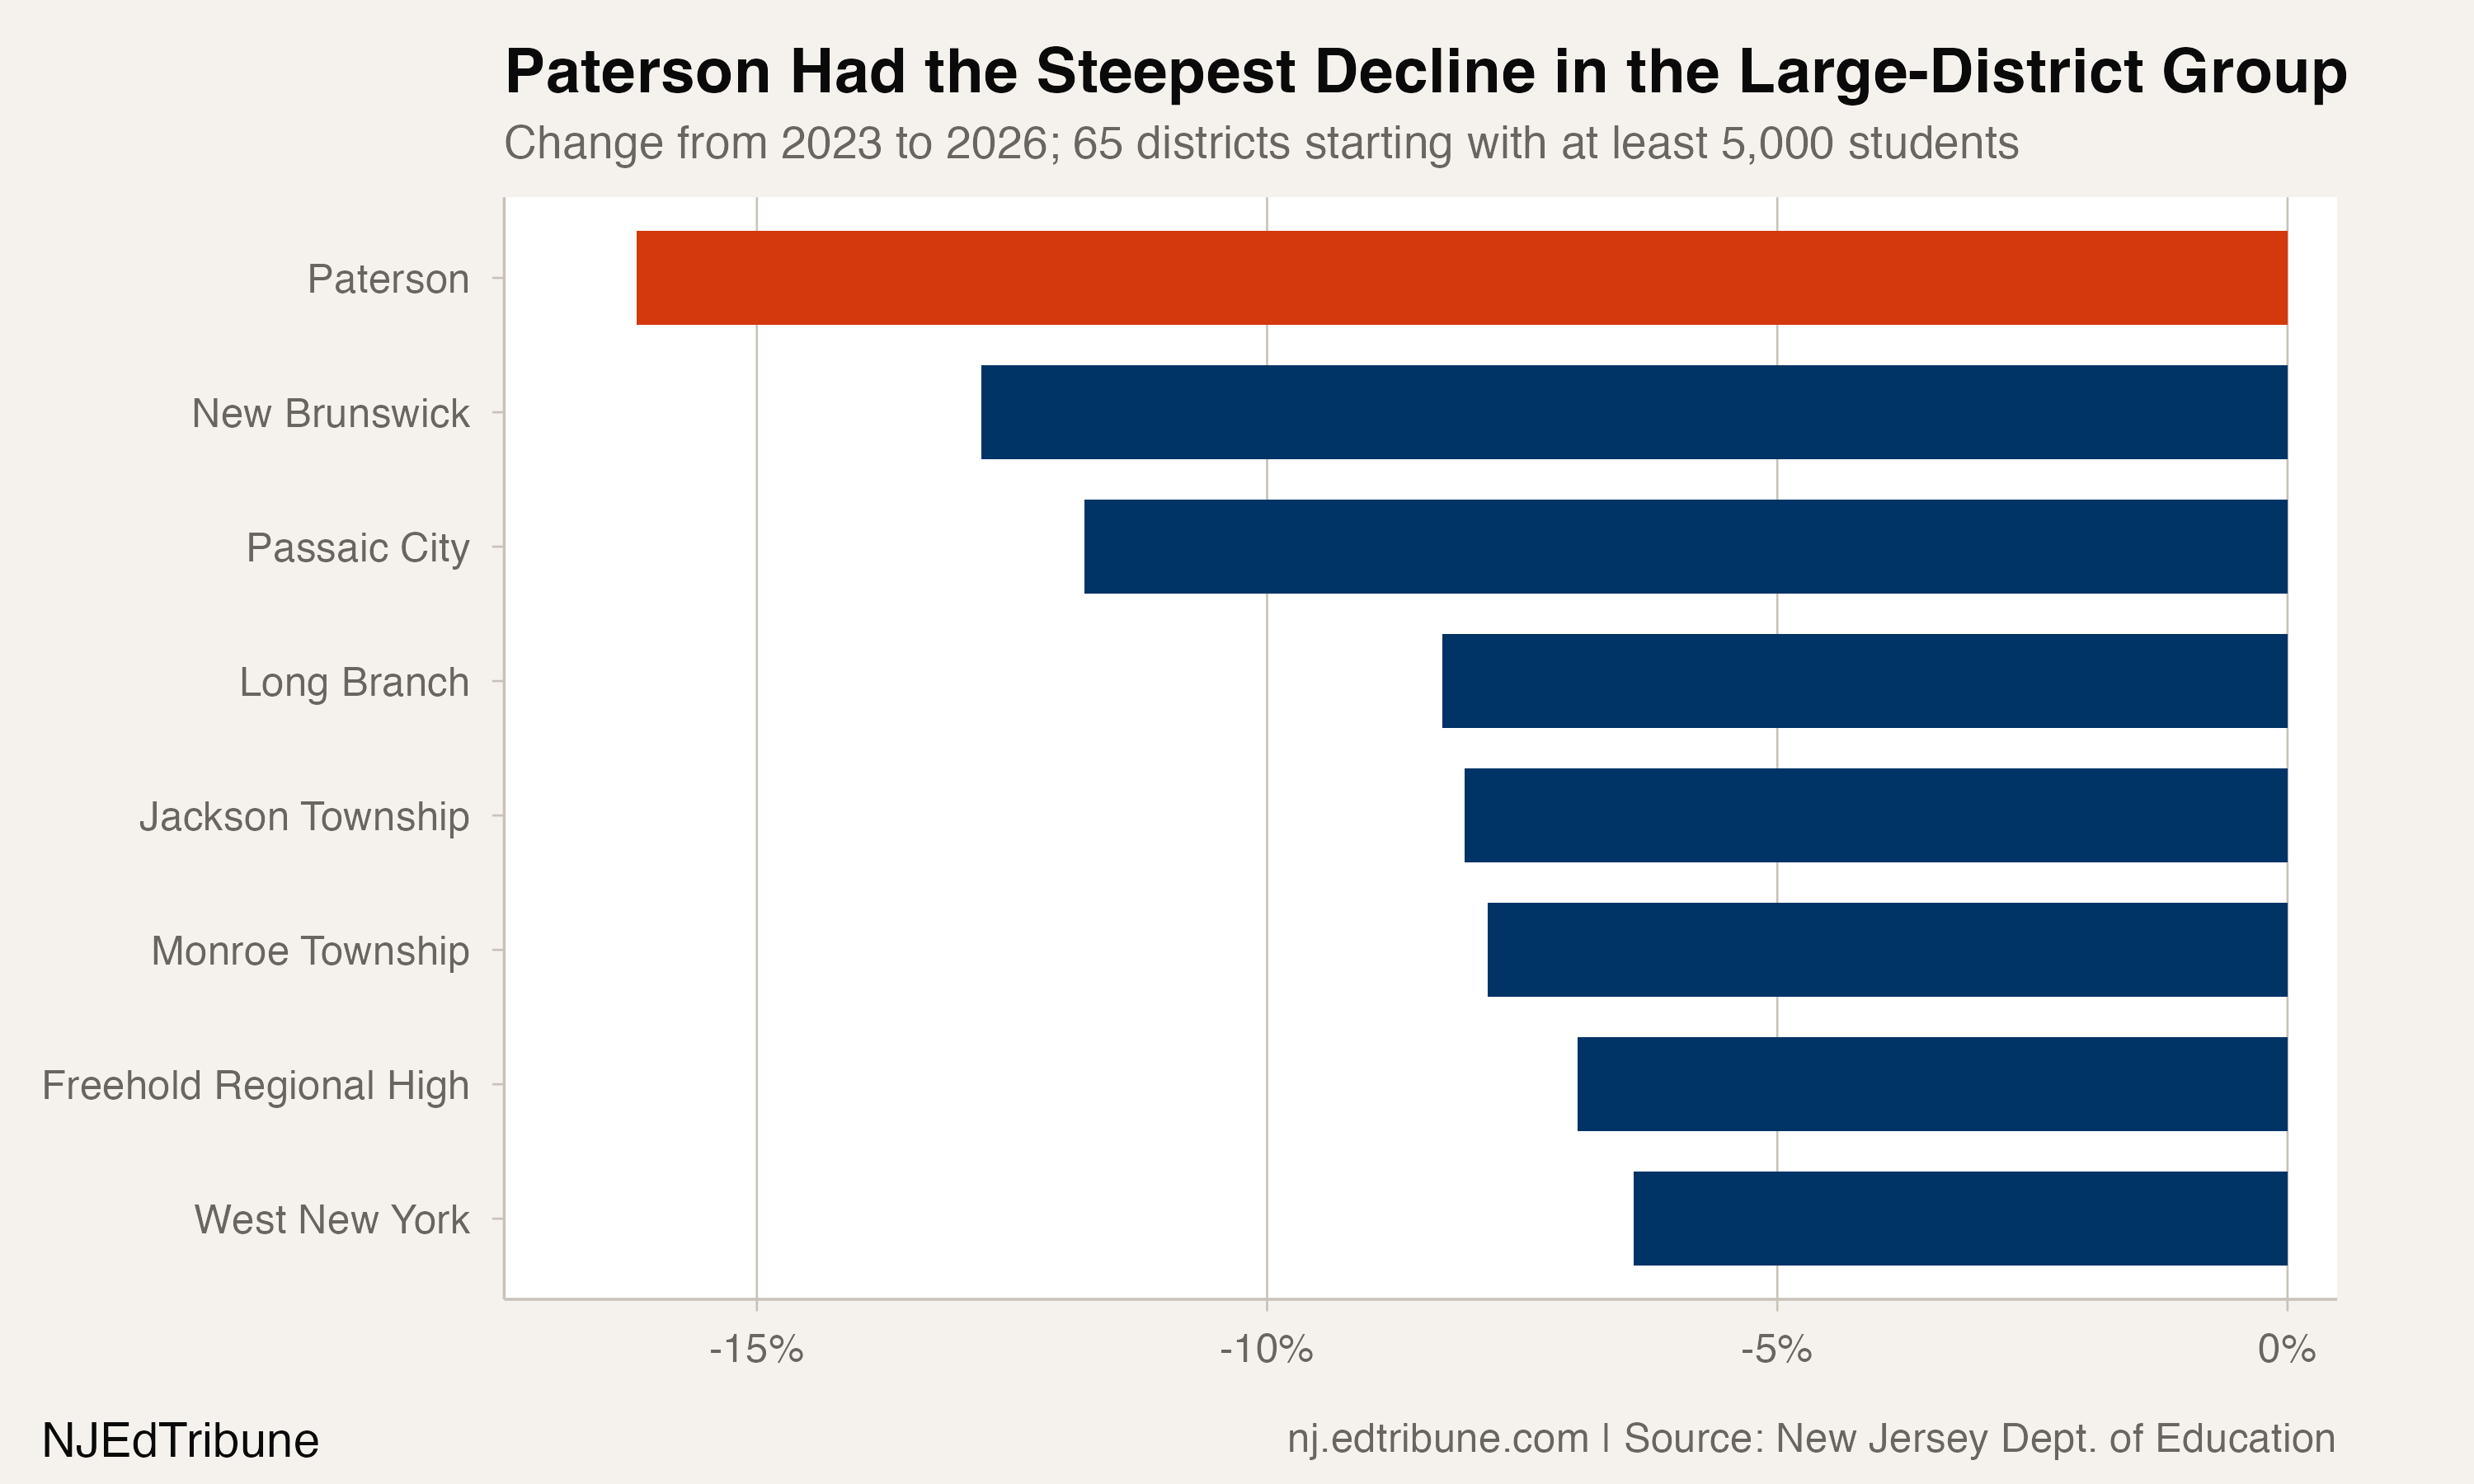
Paterson had both the largest percentage decline and the largest raw enrollment loss in a comparison of 65 non-charter New Jersey districts. The comparison includes districts with published totals in both 2023 and 2026 and at least 5,000 students in 2023. Districts are joined by stable state IDs rather than names.
Paterson's 2023 total was also the highest in its complete 2010-to-2026 series. Its two largest annual declines in that panel were the years ending in 2024 and 2026.
The longer record is not a straight decline. Paterson enrolled 24,080 students in 2010 and 24,860 in 2019. Enrollment rose by 797 students from 2019 to 2021, reaching 25,657, before later reaching the 2023 peak of 26,067.
The decline was larger in the earliest grades
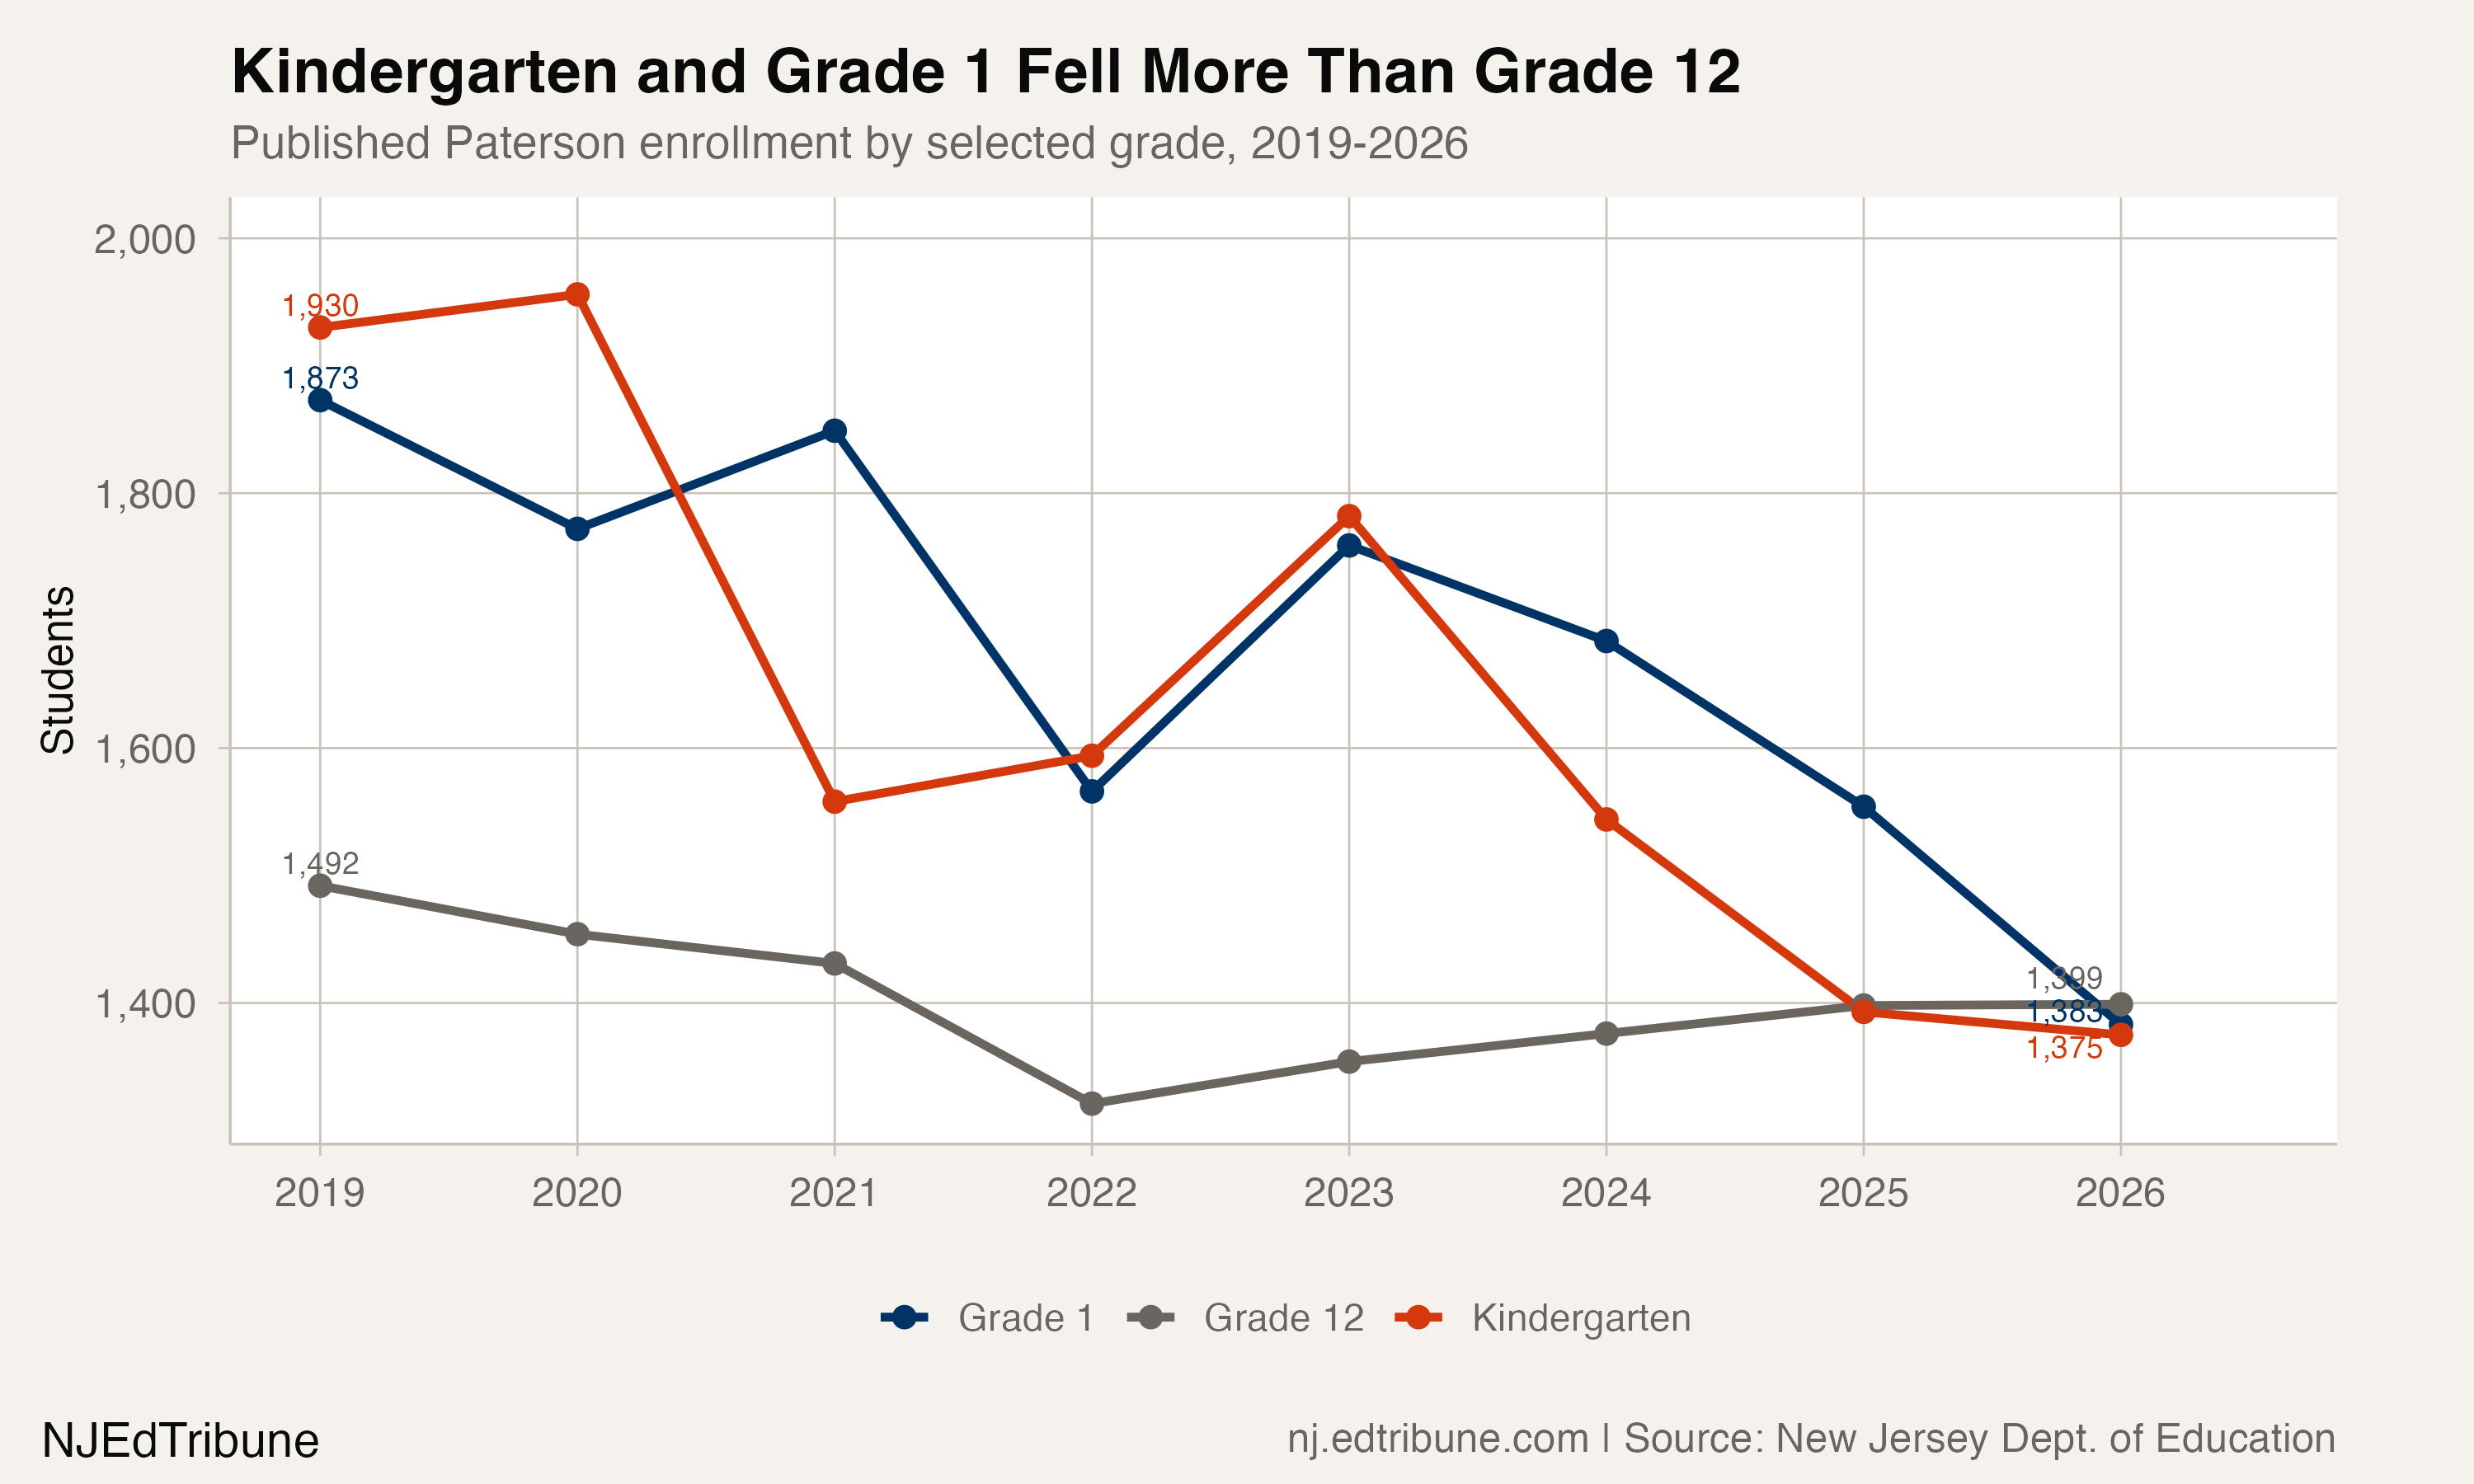
Published grade totals show a larger change in kindergarten and first grade than in the final high-school grade between 2019 and 2026.
Kindergarten enrollment fell from 1,930 to 1,375, a loss of 555 students. First-grade enrollment fell from 1,873 to 1,383, a loss of 490. Twelfth-grade enrollment moved from 1,492 to 1,399, a loss of 93.
The grade calculation stays at district grain. It first keeps distinct published program rows and then sums them within each grade and year. That step matters because the 2026 kindergarten total is published across two program codes.
What the charter comparison does—and does not—show
The state enrollment file includes both a district-total row and a school-total row for each of the Paterson-named charter districts in this analysis. Because each is a single-school charter in the published file, those two rows carry the same enrollment count. Adding both levels produces an exact double count.
At the correct district-total grain, the four charter district IDs whose published names contained “Paterson” enrolled 2,946 students in 2019. In 2026, six such charter district IDs enrolled 7,026, an increase of 4,080.
This is an explicitly name-defined group, not a complete measure of every charter school serving Paterson students. It also does not show where students previously attended or establish that charter growth caused the district's decline. The comparison describes two published enrollment series only.
The repaired analysis checks every name-matched charter year-and-ID record from 2010 through 2026. All 59 district-total rows reconcile exactly to their corresponding school-row counts. The story uses only the district-total rows.
The enrollment record establishes the size, timing and grade pattern of Paterson's decline. It does not identify why families enrolled elsewhere, moved, or otherwise left the district's count. Explaining those mechanisms would require evidence beyond the enrollment file.
The NJEdTribune contacted Superintendent Dr. Laurie Newell and Director of Communications Aida Rosario for comment and did not receive a response before publication.
Detailed code that reproduces the analysis and figures in this article is available exclusively to EdTribune subscribers.
Discussion
Sign in to join the discussion.
Loading comments...